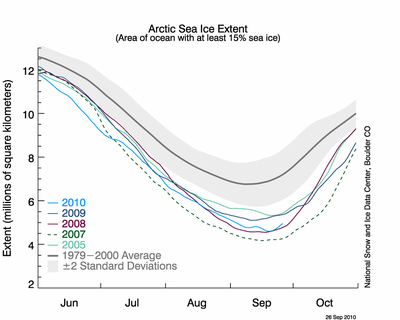
Figure 1
Figure 1. The graph above shows daily Arctic sea ice extent as of September 26, 2010, along with daily ice extents for years wtih the previous four lowest minimum extents. The solid light blue line indicates 2010; orange shows 2009, pink shows 2008; dashed green shows 2007; light green shows 2005; and solid gray indicates average extent from 1979 to 2000. The gray area around the average line shows the two standard deviation range of the data. Credit: National Snow and Ice Data Center

Document Actions
Nyheter fra Polararet.no
- 2nd Circular out for IPY 2012 in Montreal 13.05.2011
- Uenighet om ansvaret for lange tidsserier 16.04.2011
- Det norske Polaråret avsluttet 15.04.2011
- Programmet klart for Sluttkonferansen 31.03.2011
- Varmeste Golfstrøm på 2000 år 28.01.2011

