General information
MODAS: Modular Ocean Data
Assimilation System
COADS: Comprehesive Ocean-Atmosphere
Data Set
Variable: SST (Sea Surface
Temperature)
Period considered here: January 1993 - December
1997
Domain considered here: North Atlantic Ocean
(21°N - 75°N; 97°W - 14°E)
Data processing
Below, "monthly means" consist of one value for each of the 12 calendar months for each 1° grid cell. No weights have been applied, so one value contributes to the mean value of one month only.
-
Preprocessing MODAS:
- The data are transformed from the set's original resolution of 1/8° to the COADS' resolution of 1° (centered at half degrees) by an integral property conserving algorithm (half resolution), in three steps (1. 1/8° to 1/4°; 2. 1/4° to 1/2°; 3. 1/2° to 1°)
- The monthly means of the 1° fields are calculated for the 5 year period under consideration Preprocessing COADS:
- The land-sea mask is set by requiring existing (non-missing) data for all occurences of each month in the 5 year period under consideration (a call with values for all 5 January months, but not for all 5 February months will be masked in the February results, but will be "wet" in the January results etc.)
- The monthly means are calculated for the unmasked (wet) grid cells
Seasonal cycle
|
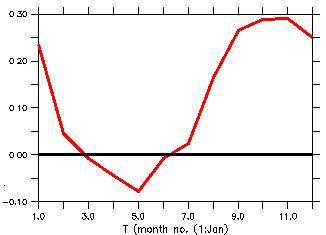
In the figure to the right, the differences in the spatially integrated monthly SST means are displayed. Here, 1 is January, ..., 12 is December, along the horizontal axis. The vertical axis gives temperature differences in °C, positive when the MODAS SST exceeds the COADS SST. |

|
|
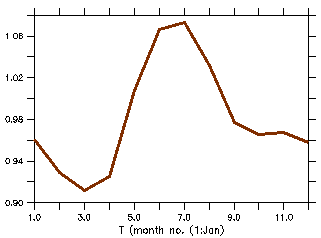
In this figure, the spatially integrated SST standard deviation from the North Atlantic COADS data are presented as a function of month (brown line), based on the entire 38 year history of the COADS 1° SST product (1960 through 1997). Numbers on the vertical axis are in °C. |

|
We note that the MODAS data seems to be warmer than the COADS data for most of the year, the difference peaks at about 0.3 °C in fall. During spring, the COADS data are warmer, but never by more than 0.1 °C.
From the depiction of the standard deviation of the COADS SST, we observe that this quantity is about 1 °C for the entire year. Hence, we conclude that the discrepancies between the MODAS data and the COADS data will probably not give rise to very different results when examining propagation of anomalies on an interannual time scale. (Obviously, the period of the MODAS data are a bit on the short side for such a study.)
Results for selected months
|
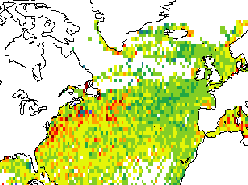
In the figure to the right, the differences in the SST means for October are displayed (COADS subtracted from MODAS). The color coding corresponds to the temperature difference. Positive differences dominate in the southwestern region of the North Atlantic. This is particularly seen in the region of the Gulf Steam and its extension (although some noisy behavior can be oserved in the latter region). |

|

|
|
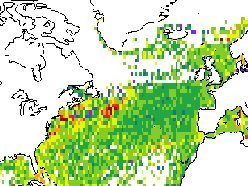
Here, the differences in the SST means for May are displayed. The pattern of the differences is quite similar to the depiction for October above, but the differences seem to be shifted by about one degree. |

|