Introduction
Results from nearly all coupled atmosphere-ice-ocean numerical modeling studies of greenhouse gas scenarios indicate that global warming will be enhanced in the polar regions, especially in the northern hemisphere (Manabe et al., 1992), with a predicted warming of about 34 °C in the next half-century (Mitchell et al., 1995), and a drastic decrease of the sea ice in the Arctic Ocean (Cattle and Crossley, 1995; Vinnikov et al., 1999).
Recent analyses of the ice cover in the Arctic Ocean have established that significant changes have occurred in the latter part of the 20th century. Analysis of upward looking sonar observations from US nuclear submarines indicate that the average ice thickness has decreased from 3.1 m in the 19581976 period to 1.8 m in the 1990s, in average 4 cm per year, or totally 40% of the total ice volume (Rothrock et al., 1999).
Furthermore, analysis of microwave satellite observations has established that the total sea ice area has decreased by 6% over the last two decades (Johannessen et al., 1995; Bjørgo et al., 1997; Parkinson et al., 1999)), while the multi-year ice area has decreased by 14% over the same period (Johannessen et al., 1999). As stated in Vinnikov et al. (1999), this is "suggesting strongly" that the observed decrease in sea ice extent since 1950 is related to the anthropogenic global warming. Prediction by two coarse resolution global climate models furthermore suggest a substantial decrease of the sea ice extent in the 21th century (Vinnikov et al., 1999).
However, the elevated indices of the North Atlantic Oscillation (NAO) (Hurrell, 1995) and the Arctic Oscillation (AO) (Thompson and Wallace, 1998), indicate a pumping of warm air and water masses into the Arctic from the North Atlantic region causing ice melt as well as a mechanism for exporting multi-year ice through the Fram Strait (Hurrell, 1995; Thompson and Wallace, 1998; Rothrock et al., 1999). Even some effects on the variability of the sea ice from El Niño has been reported (Gloersen, 1995). Therefore, the decreasing ice cover is probably caused by a combined effect of greenhouse warming (century time scale), high indices of the AO/NAO index (decadal time scale) and even the Atlantic Multidecadal Oscillation (AMO) (Kerr, 2000).
This note looks on some of the trends and variabilities seen in the Arctic over the last decades, and on the validity of the model used in the NOClim project. The focus will be on the trends of the ice cover in the Arctic ocean, with a quick look at probable causes for these trends.
Model and observations compared
The coupled ice-ocean model used here is an Atlantic-Arctic version (Drange, 1999) of the Miami Isopycnic Coordinate Ocean Model (MICOM) (Bleck et al., 1992), coupled with the dynamic sea ice model of Harder (1996) and the thermodynamical module of Drange and Simonsen (1996). The model was integrated from 1958 until 1998 after a 30 year spinup integration initialized with salinity and temperature climatologies from Levitus et al. (1994) and Levitus and Boyer (1994), respectively. The forcing data for the 19581998 period was taken from the Environmental Prediction (NCEP)/National Center for Atmospheric Research (NCAR) Reanalysis project for 19581998 (Kalnay et al., 1996).
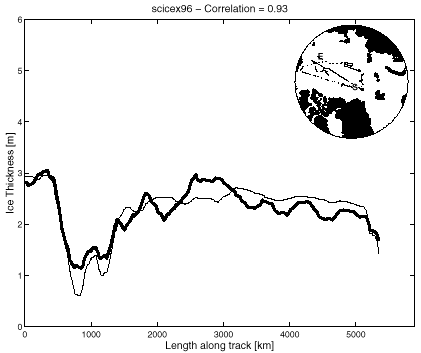
Comparison with observations have shown that the model gives a reasonable description of the Arctic ice cover, with the main deficit being a too low ice extent. Compared with satellite derived values, the model ice extent deficit is ~1·106 km2 which is a significant portion of the yearly mean value of ~8·106 km2. However, this deficit is mostly a result of a too receeded ice edge in the model, the ice in the central Arctic Ocean seems to be described better. This can be seen in Figure 1a which shows a comparison between model ice thickness and estimates from submarine sonars during the SCICEX cruise in September 1996.
Nine submarine cruises have been compared in this manner, and the comparison revealed similar ice thicknesses in both model and submarine data. The total comparison gave an overall correlation of r=0.80.
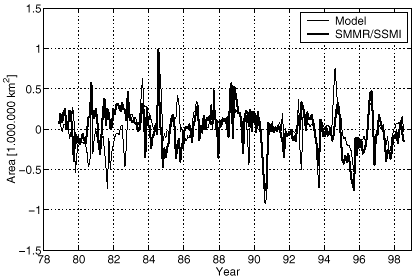
Despite of the too low ice extent, the model reasonably describes the variations of this variable. By subtracting the mean annual cycle from model and satellite derived data we get the time series in Figure 1b. The two time series have a correlation of 0.64 from 19841998 (the period 19781984 was not used due to suspected error in atmospheric forcing). The trends of model and satellite data are also similar over the time period 19841998, with a value of ~10·103 km2. Note that because we are comparing model and satellite data over their common region the trend is lower than that reported by other investigators of sea ice extent, e.g., Bjørgo et al. (1997).

|
|
Figure 1a: Model ice thickness (thin line) compared with ice thickness estimates from upward looking submarine sonar during SCICEX96 (thick line). The horizontal axis show the distance covered along the track (only including segments where measurements are performed). The letters 'S' and 'E' denote start and endpoints of the submarine cruise, respectively. |

|
|
Figure 1b: Time series of sea ice extent anomalies from model (thin line) and satellite data (thick line). The anomalies are based on the average seasonal cycle. |
Trends for the Arctic ice cover
With the aid of remote sensing sensors, we have a good idea of how the Arctic sea ice concentration has been for the last two decades. The observations show us that
- The total area of the sea ice cover was reduced by 6% over the last two decades (Bjørgo et al., 1997; Parkinson et al., 1999).
- The area of multi-year sea ice was reduced by 14% from 19781998 (Johannessen et al., 1999)
The high temporal sampling of passive microwave data from the Arctic regions (sampled at a daily basis) gives a good confidence in these trends. The trend in multi-year ice reported by Johannessen et al. (1999) is important because it also gives a connection with spatial-integrated ice thickness. This was seen by comparing multi-year ice area with spatially-integrated ice thickness estimates from Russian drifting stations. The Russian drifting stations measure elastic-gravity waves in the ice, and use a dispersion relation to calculate a spatially-integrated ice thickness. The comparison of multi year ice with these thickness estimates revealed a correlation of r=0.88.
Sea ice thickness sampled from the Arctic Ocean is mainly derived from cruises undertaken by British and American Navy submarines. These cruises are not performed at a regular basis, so it is a difficult task to calculate a trend with a high statistical confidence from the data sets. To make matters worse the cruises are not necessarily performed over the exact same track, which further complicates the statistical analysis. Publications discussing a trend for ice thickness in the Arctic come with the following conclusions:
- The thickness of the Arctic sea ice was reduced by 1.4m from the 19501970 period to the 1990s, the trend is amplified in the 1990s with a reduction of 10cm/year (Rothrock et al., 1999).
- Wadhams and Davis (2000) finds a ice thickness reduction of almost 2.0m from 19761996 based on two cruises in a region from Fram Strait to the North Pole. The majority of this reduction is thought to have happened from 19761986.
- Winsor (2001) finds no apparent trend in the 1990s, by analysing several cruises.
It should be noted that the trends are estimated for different regions. For instance the 1990s trend from Rothrock et al. (1999) is calculated over the Arctic as a whole, while the trend of Winsor (2001) is calculated for a region from the North Pole to the Beaufort Sea. If we look at our model run it shows a basin-wide thinning of ice by 2 cm/year from 19841998. This appears to be in accordance with the conclusions of Winsor (2001) and Wadhams and Davis (2000), we stress however that these trends are based on smaller regions, while our model ice thickness trend is a basin-wide estimate.
Possible causes for the trends
A possible cause for the trends seen in the Arctic ice cover are changes in the near-surface layers of the Arctic Ocean. Characteristic of the waters of the central Arctic Ocean is a Cold Halocline Layer which effectively insulates the Surface waters from warmer waters underneath. In 1995 this layer disappeared at some locations. The retreat of the CHL means that the waters of the Arctic Ocean more closely resembles those of the Antarctic. The oceanic heat fluxes into the mixed layer in the Arctic (with CHL) is ~1W m-2, whereas that of the Antarctic is ~20W m-2(Martinson and Steele, 2001). The equivalent reduction in ice growth over one year created by an absent CHL was estimated by Martinson and Steele (2001) to be on the order of 1m. Note that this is of the same order as the total ice thickness reduction from the 19501970 period to the 1990s, as estimated by Rothrock et al. (1999).
The retreat of the CHL is probably linked to increased cyclonic atmospheric circulation in the Arctic. The cyclonic circulation is linked to the AO, with high AO describing cyclonic circulation. The influence of AO on many factors regulating ice growth in the Arctic basin is described by Dickson et al. (2000) including among other things atmospheric heat transport, atmospheric moisture transport and Atlantic water transport, however the strongest response is possibly given by the before mentioned retreat of the CHL. Increased oceanic heat flux is also described by Rothrock et al. (1999) as one of the factors which could give the reduction of 1.4m from the 19501970 period to the 1990s.
Summary
Some of the trends seen in the Arctic ice cover over the last decades has been presented and possible causes as presented by litterature has also been given. Due to little data there still exists some unxcertainty on the thickness and thickness trends of the ice cover.
Some results from one of the model data sets used in the NOClim project has also been presented, and the model seems to do a fairly good job describing the Arctic ice cover. In the future we aim to further analyze this data set in order to examine trends of the Arctic ice cover, and investigate reasons for these trends.