Results for 2014, quarter 3
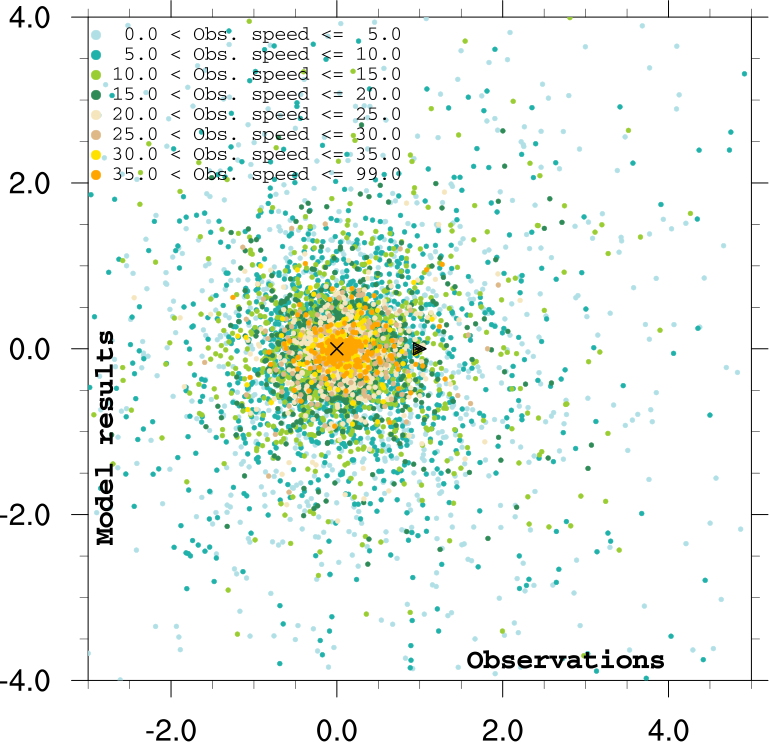
Near-surface drift vs. buoy data, Nordic 4km
Near-surface drift vs. buoy data, Arctic 20km
Near-surface drift vs. buoy data, Nordic 4km
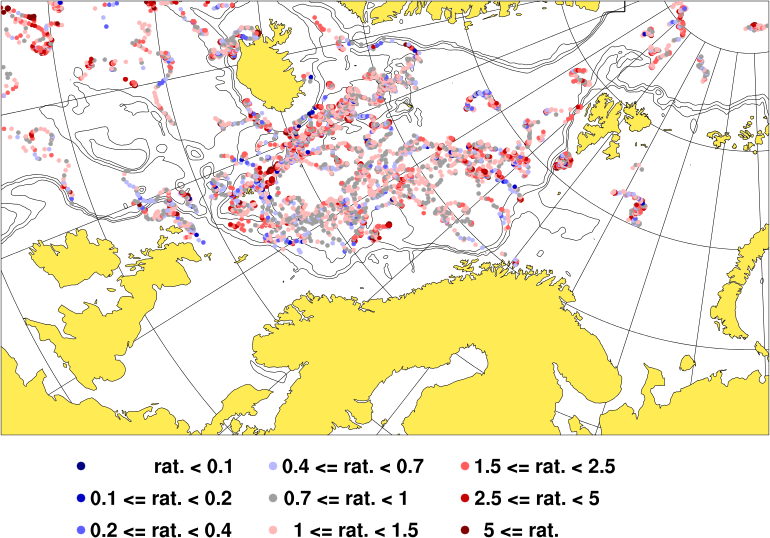
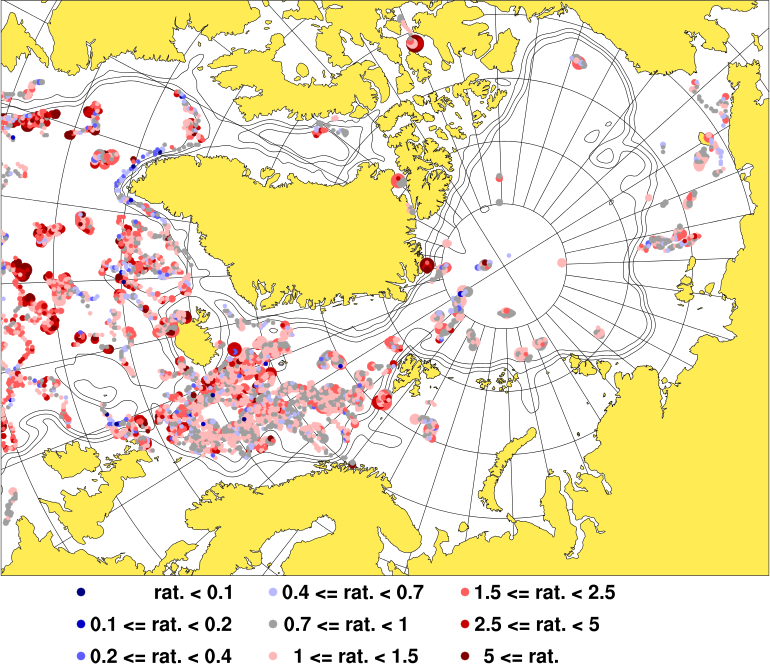
Map of ratio, of end position separation vs. observed drift
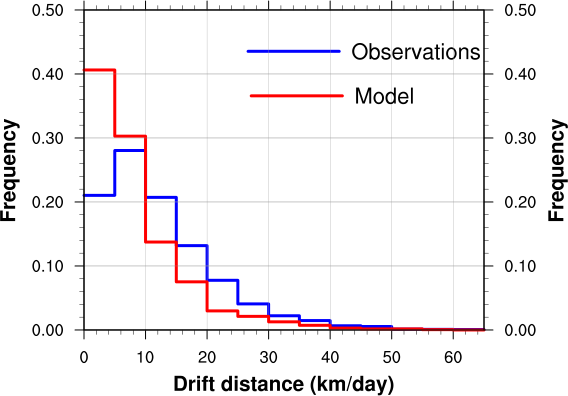
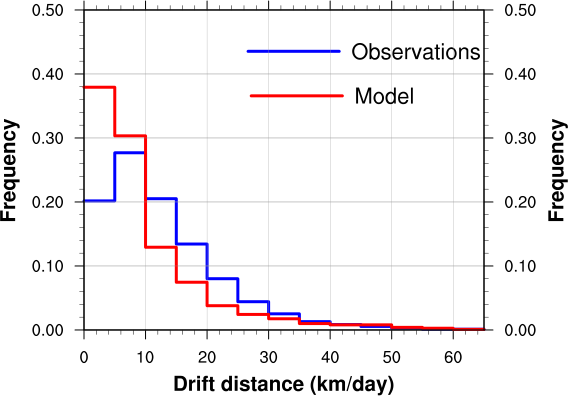
PDF of drift (observed, modeled)
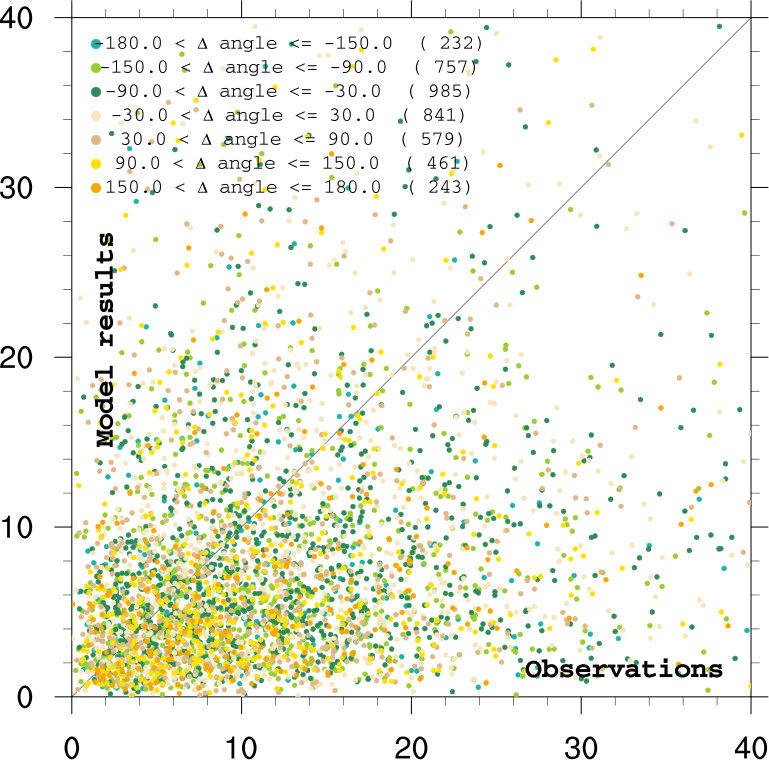
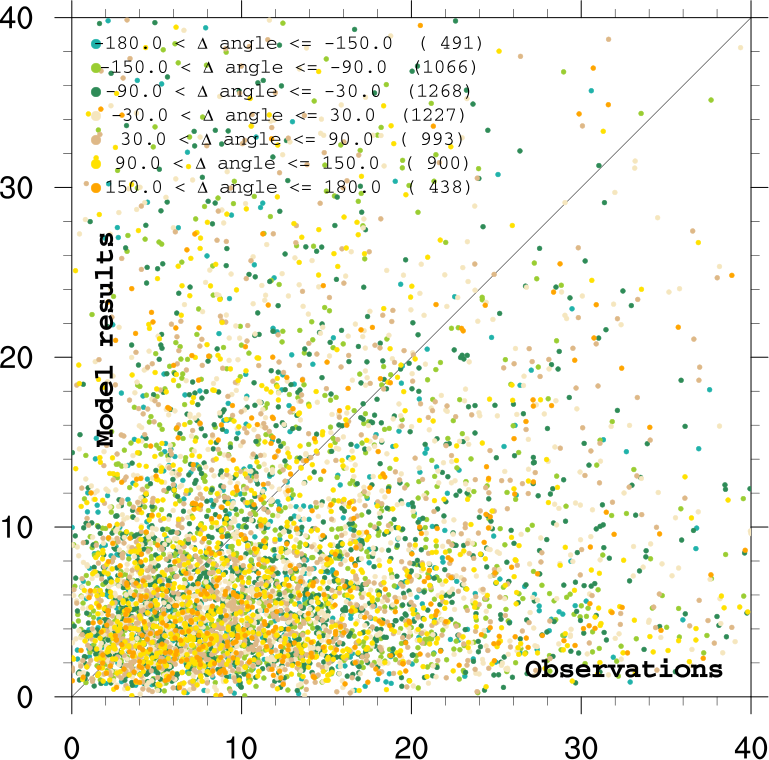
Drift distance scatter (km/day; colors are angular offsets)
Normalized drift w/ observed drift as x-axis
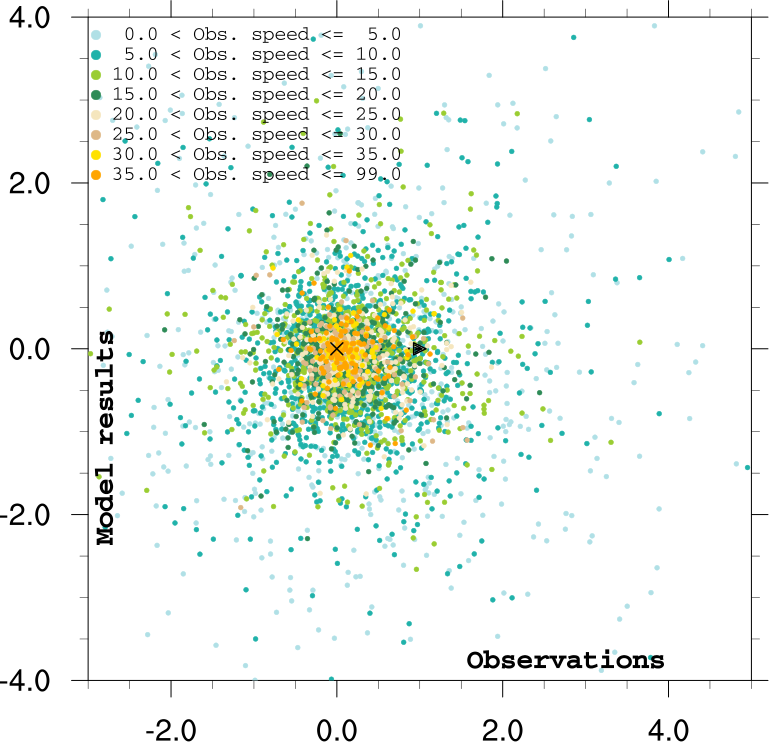
Near-surface drift vs. buoy data, Arctic 20km
Map of ratio, of end position separation vs. observed drift
PDF of drift (observed, modeled)
Drift distance scatter (km/day; colors are angular offsets)
Normalized drift w/ observed drift as x-axis