| Effect research |
| Dynamical downscaling |
| Model Results |
| Refined Results ... |


| Main | Maps | Data | Contact | RegClim |
These pages have been made for distribution of results from dynamical downscaling of global climate change scenarioes obtained in the RegClim-project Phase III (2003-2006), founded by the Norwegian Research Council). The maps may be used as illustrations for climate change scenarioes in Norway, and the data may be used for impact studies. The pages are maintained by the Norwegian Meteorological institute through the Norwegian Service Centre for Climate Modelling (NoSerC). The main tool for dynamical downscaling in RegClim is the HIRHAM regional climate model.
Recent results ... March 2005


HIRHAM downscaling of SRES A2 and B2 scenarioes
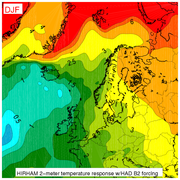
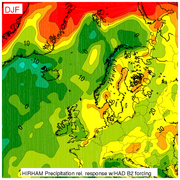
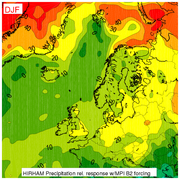
Two time-slices from global climate model (GCM) simulation based on SRES A2 and B2 greenhouse gas concentrations have been downscaled with the atmospheric regional climate model (RCM) HIRHAM. The area of downscaling covers central and northern Europe, adjacent sea-areas and Greenland. The GCM data for lateral boundary forcing in the RCM was provided from the Hadley Centre, U.K. (HC) and Max Planck Institute, Germany (MPI), respectively. These were created in two steps; (1) a global low-resolution transient simulation with a coupled atmosphere-ocean-ice model (AOGCM) followed by (2) a global medium-resolution time-slice simulation with an atmospheric model (AGCM) using ocean-ice-state based on (1) or, in the case of the HC, an observation-based correction of (1). The time-slices cover the control period 1961-1990 and the climate scenario period 2071-2100. RCM simulations were carried out with a resolution of 55km.
Scenarios for the development of the global climate as a consequence of presumed atmospheric concentration levels of anthropogenic (and natural) greenhouse gases are based on coupled global climate models (GCMs) with coarse atmospheric horizontal grid-resolution (typically ~280 km or T42). For most environmental impact studies this resolution is far too coarse. Topography and patchy geographical features, such as coastlines, snow-cover, vegetation, watersheds etc., are too smoothly represented for a direct quantification of impacts in most cases. Furthermore, features associated with atmospheric dynamics and physics are also crudely represented. For extreme weather such as strong winds and heavy precipitation, horizontal resolution is an important issue. Such events are frequently connected with spatially abrupt features like sharp fronts and squall lines, meso-scale vortices, steep mountain slopes and topographical corner effects. Hence, an analysis of potentials for anthropogenic change in occurrence of extreme values of weather elements can not fully rely on raw output of global climate models.
The HIRHAM RCM (Christensen et al. 1997; 1998) was imported from Max Planck Institute (MPI), Hamburg, in 1997 and a similar version is at present also used at the Danish Climate Centre, Copenhagen. The main component of HIRHAM is described in Bjørge et al. (2000). The model is running on a rotated spherical grid (approximately 55 km resolution) and with 19 levels in the vertical. The integration domain covers 96x96 grid squares. The physical parameterizations are adapted from the ECHAM4 ACGM (Roeckner et al. 1996).
Data from two AGCMs, HADAM3H and ECHAM4 were supplied from the Hadley Centre (HC), U.K. and MPI, Hamburg (MPI), respectively. The HC-data were originally made available for the PRUDENCE-project, while the ECHAM4-data were kindly supplied by the MPI-staff (D. Jacob, pers. comm.). Both centers have carried out transient coupled atmosphere-ocean-ice AOGCM runs from pre-industrial conditions in 1860 up to the end of this century 2100, using observed greenhouse gas concentrations until model year 1990 followed by IPCC SRES A2 and B2 concentrations from 1990-2100. The B2-scenario assumes a gradual increase in CO2 emissions from ca. 7 Gt(C)/a in 2000 to ca. 13 in 2100. This is amongst the moderate scenarios for CO2 increase used in IPCC TAR (IPCC, 2001). The range of model-estimated increase in global mean surface temperature from 1990 to 2100 was 1.8 - 3.2 oC.
The actual global forcing for the two RCM simulations were from medium-resolution (T106) AGCM re-runs for the two 30 year time-slices used in the present study, i.e. 1961-1990 and 2071-2100, using prescribed SST and sea-ice distributions (details are not included here). The time-slices are preceded by spin-up periods (1 year in the case of HIRHAM) which are ignored in the analysis.
Acknowledgment
The work reported here is funded in part by the Norwegian Research Council, through grant no. 120656/720 to the Norwegian Meteorological Institute/RegClim. Computational costs are covered by a grant from the Research Council's Programme for Supercomputing. The Hadley Centre, the PRUDENCE project at the Danish Climate Centre and the staff at MPI (Dr. Daniela Jacob) is gratefully acknowledged for support of the global data.
References
Jan E. Haugen RegClim/met.no 2005
Send comments to webmaster