|
|
|
|


RegClim PM1 - Regional Downscaling
| Main
| Maps
| Data
| Contact
| RegClim |
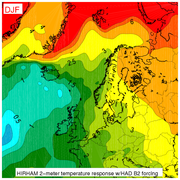
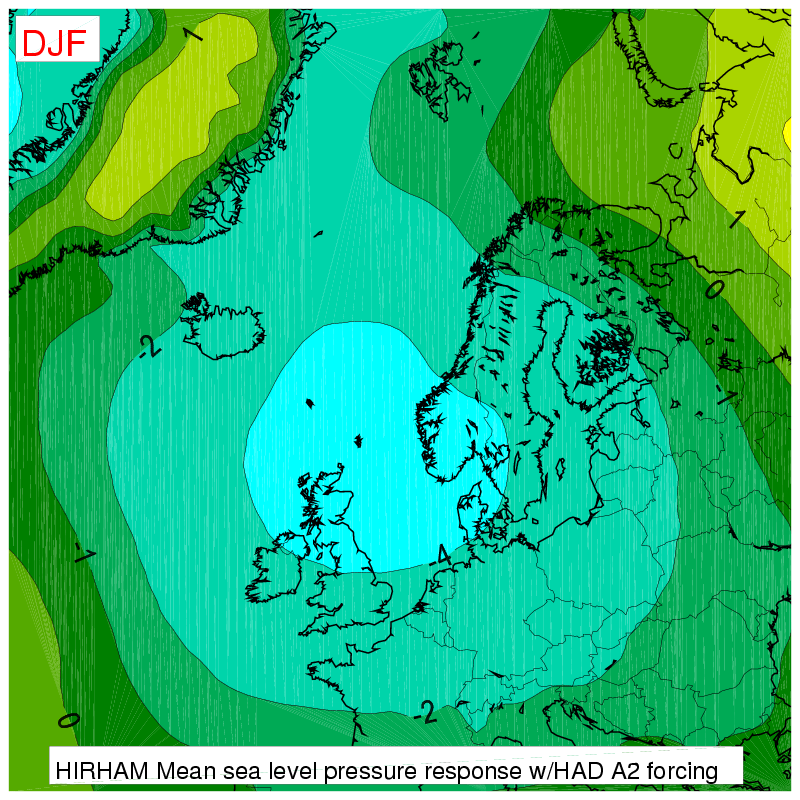
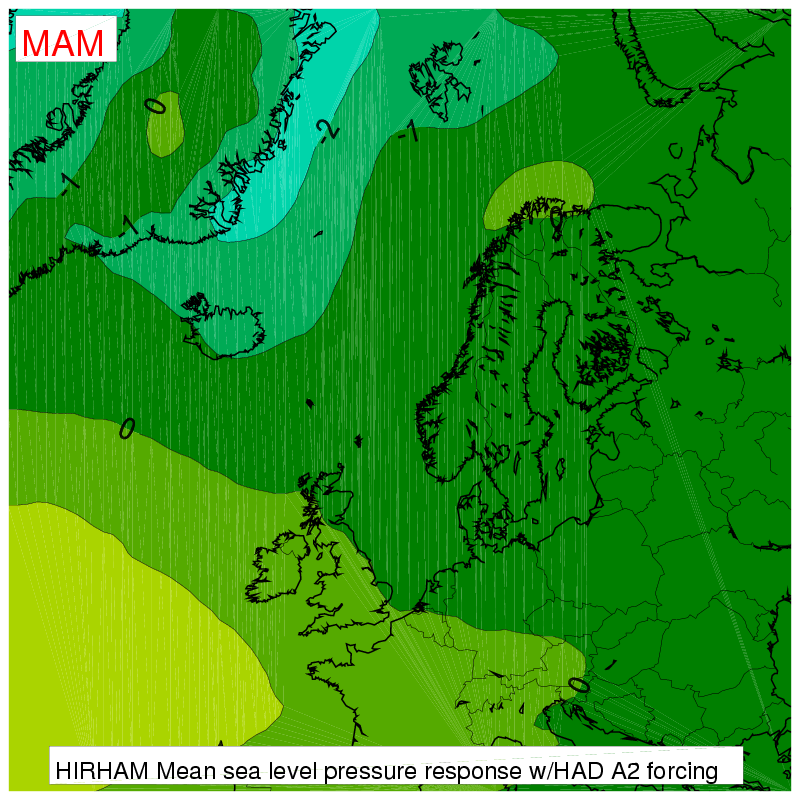
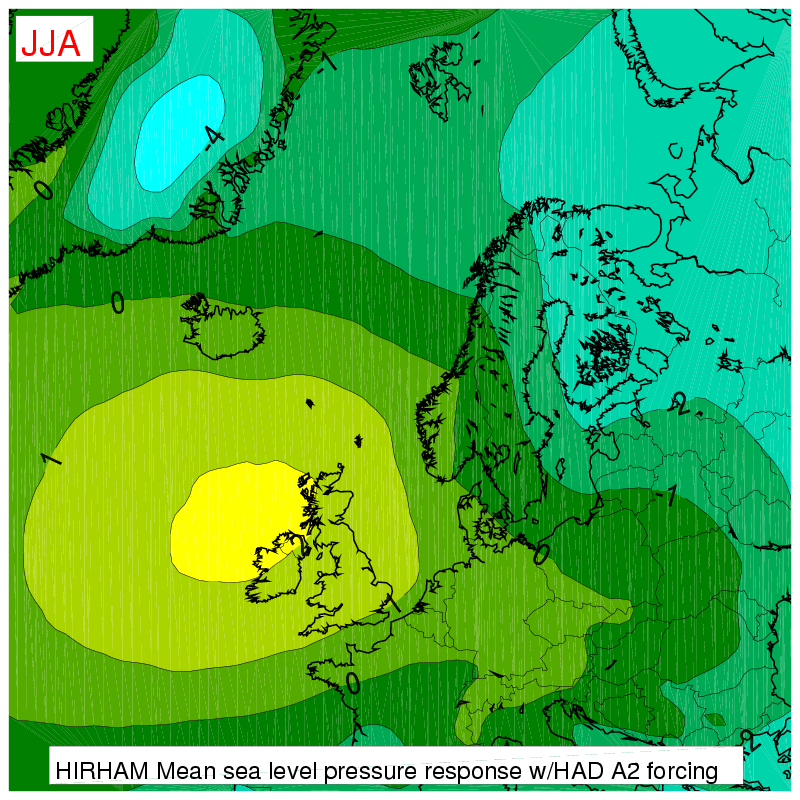
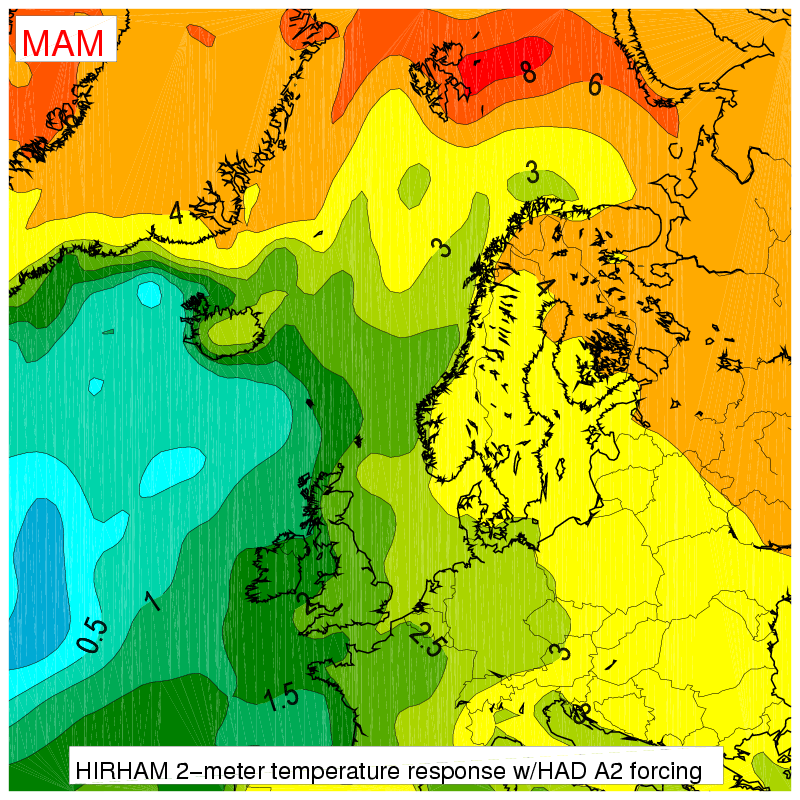
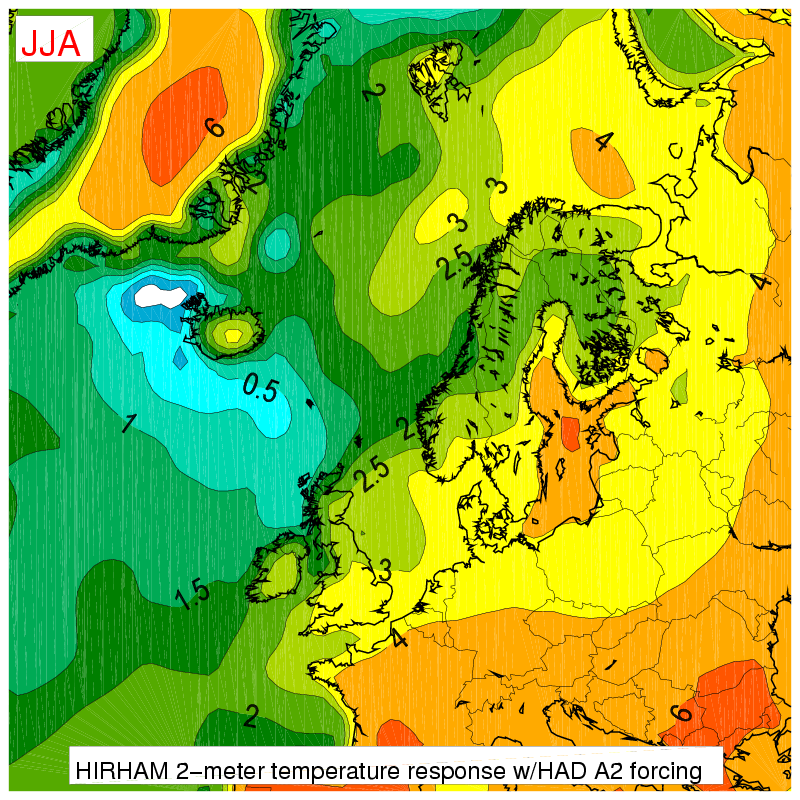
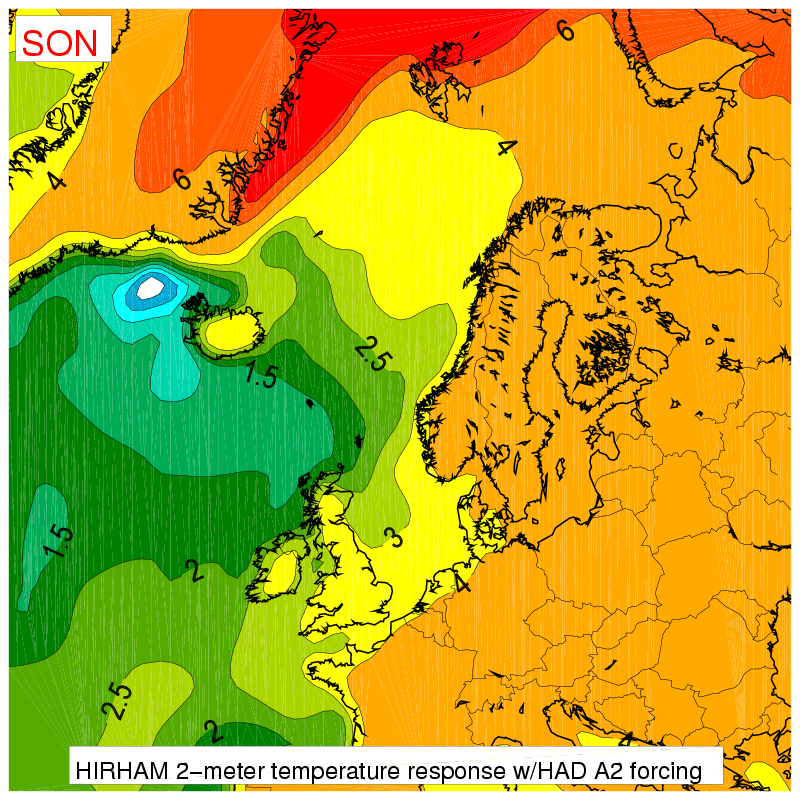
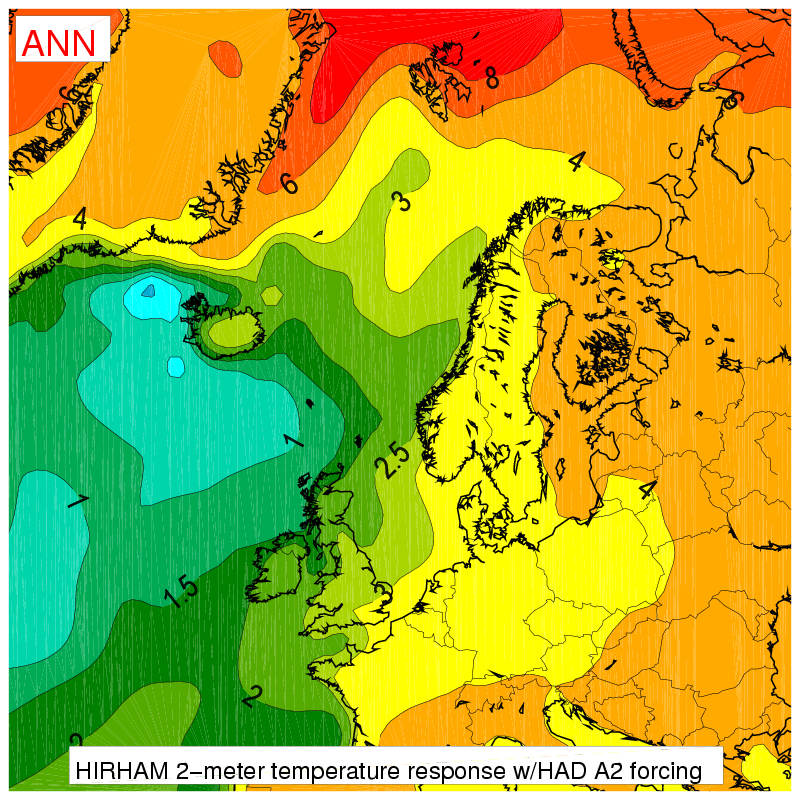
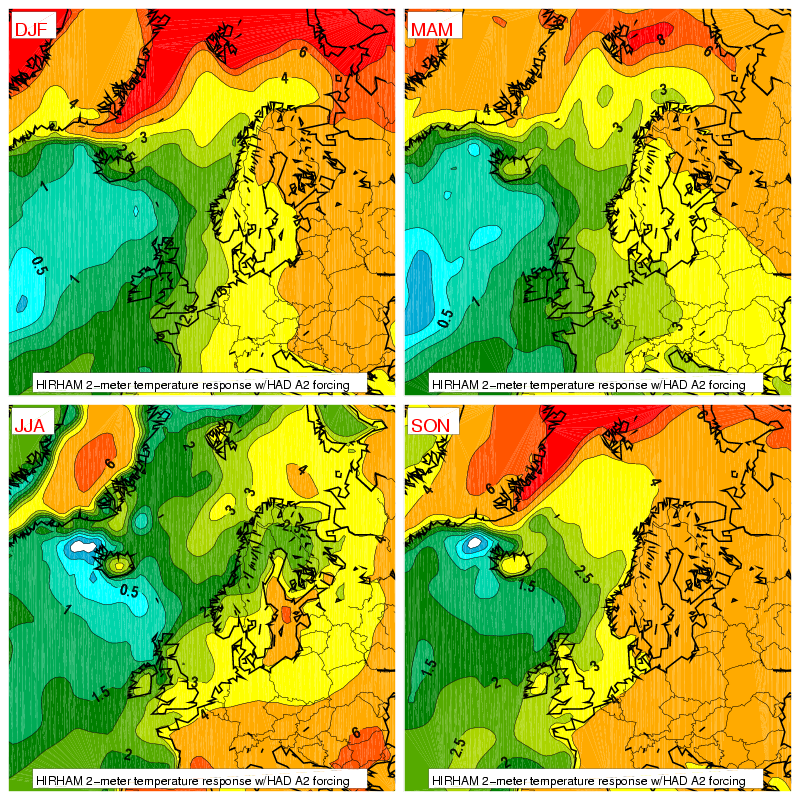
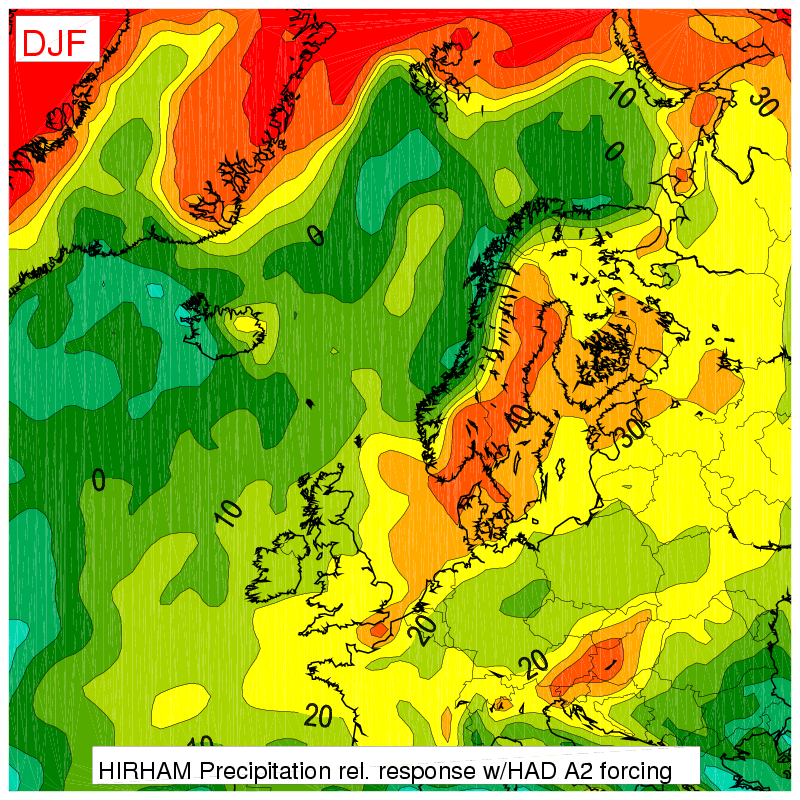
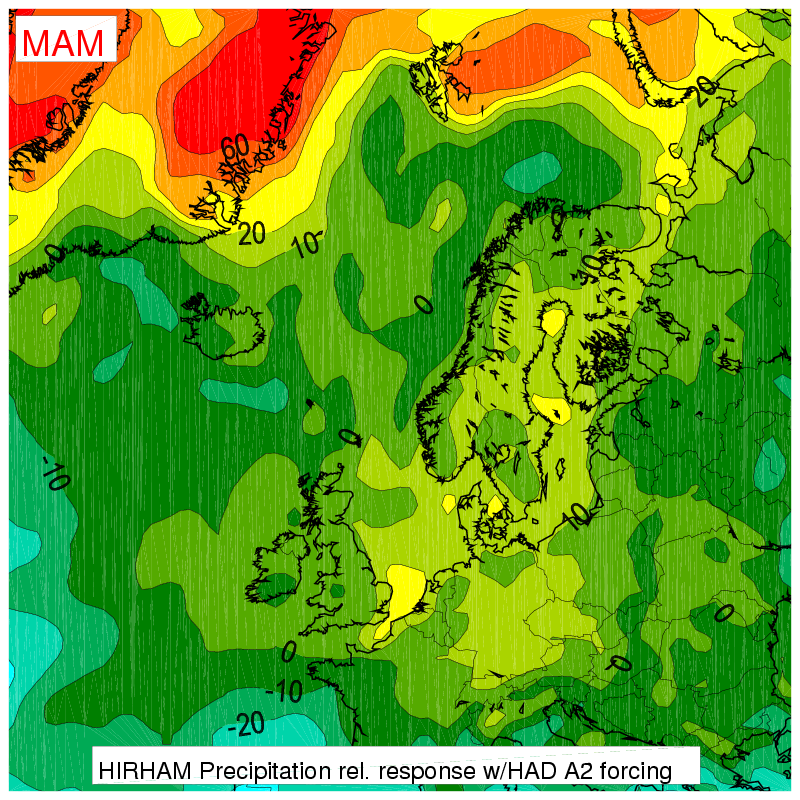
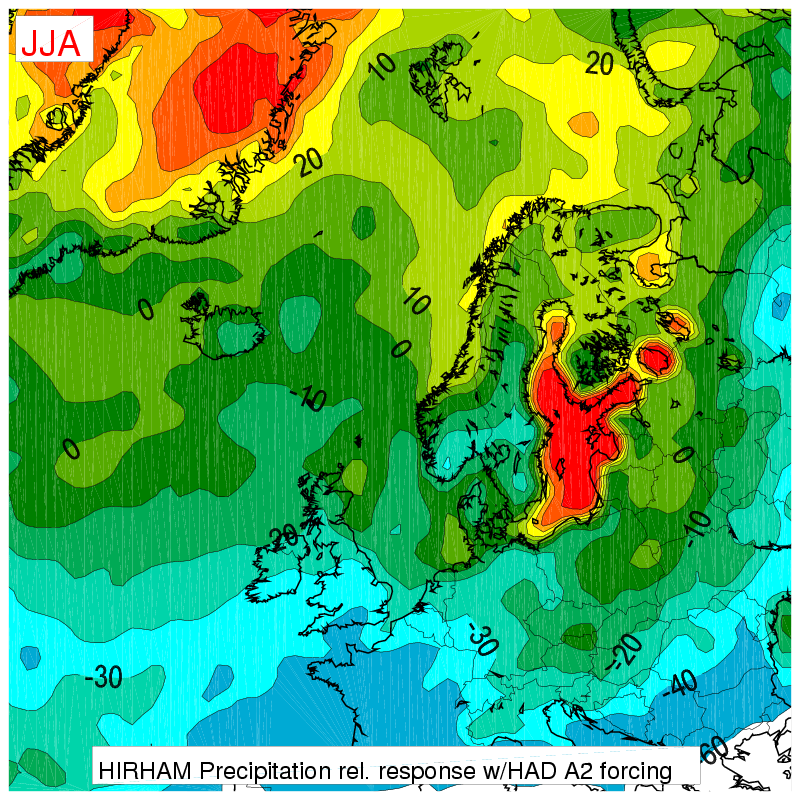
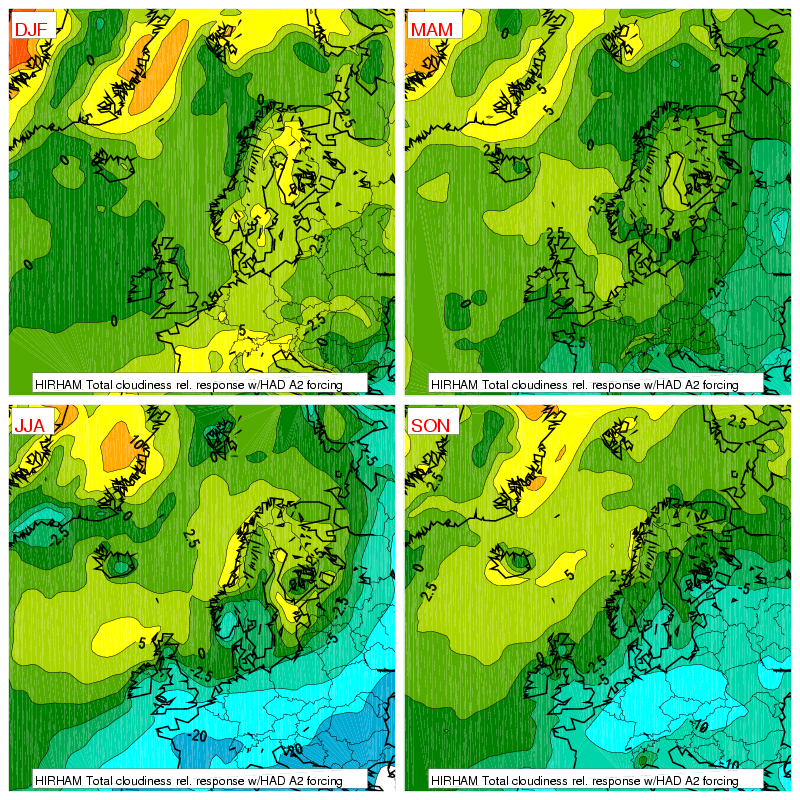
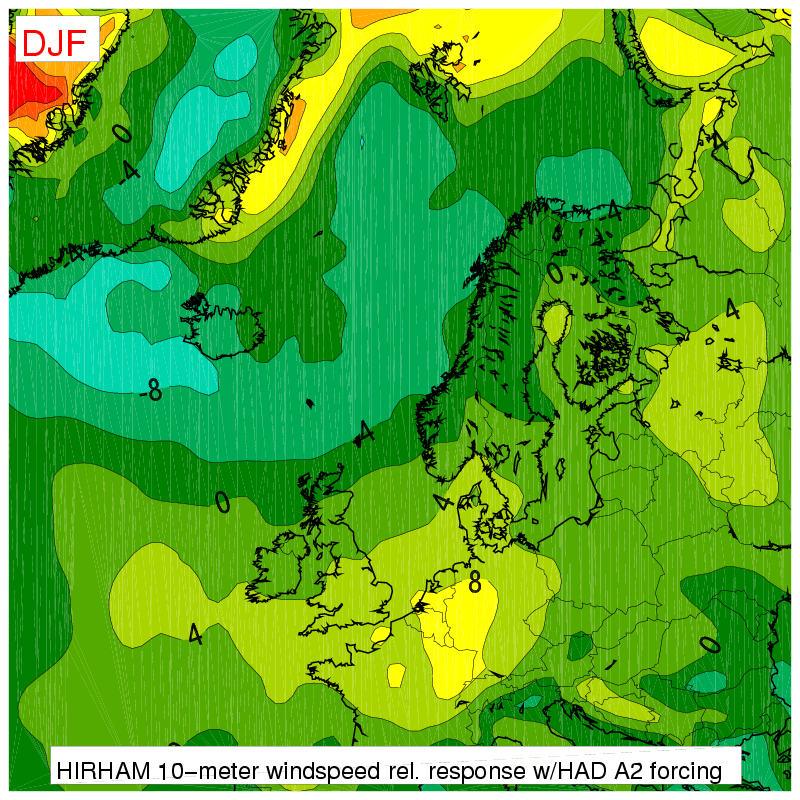
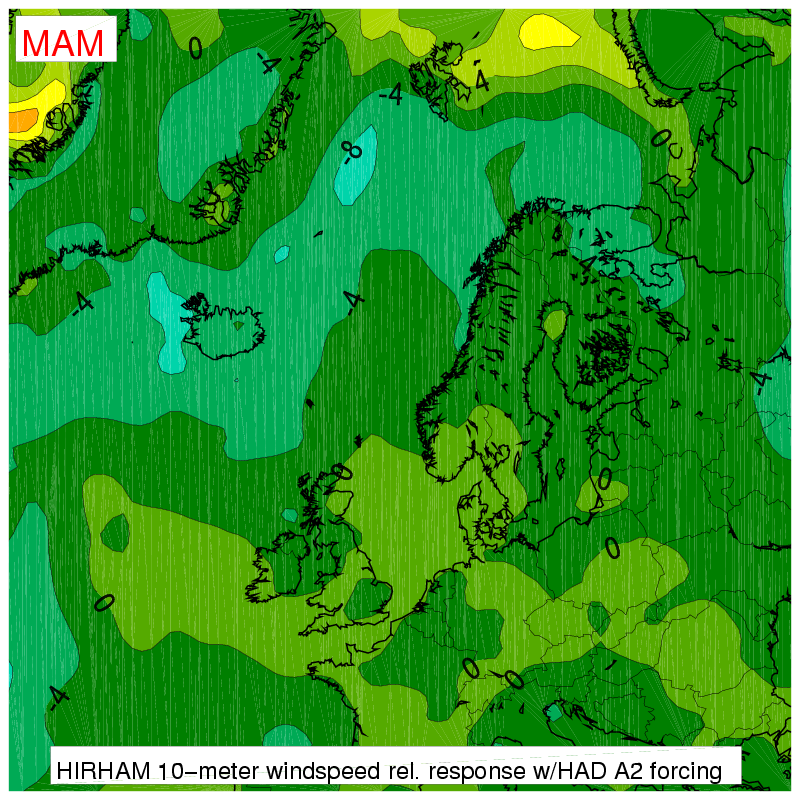
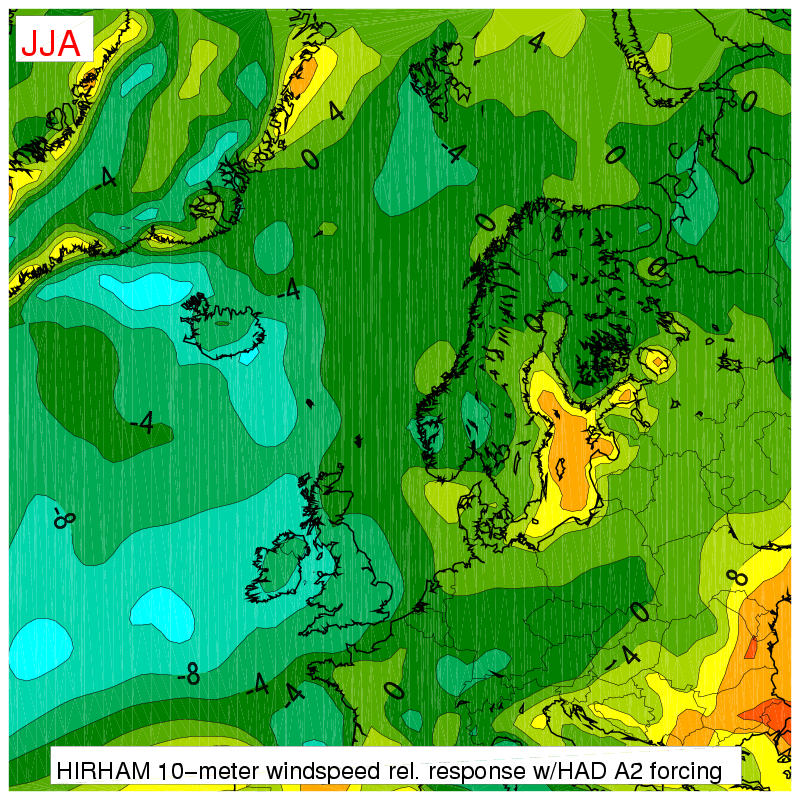
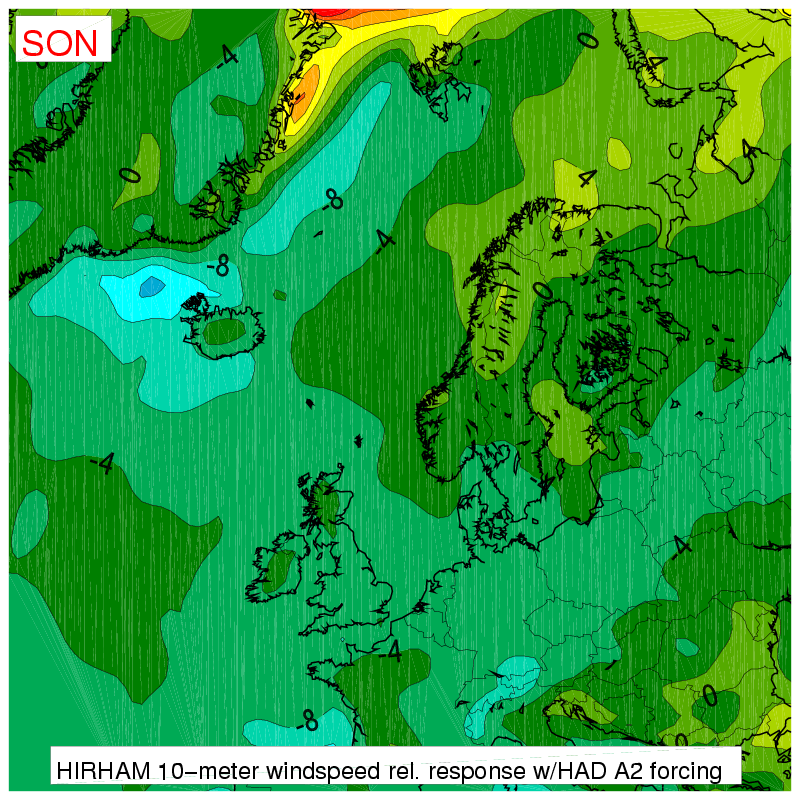
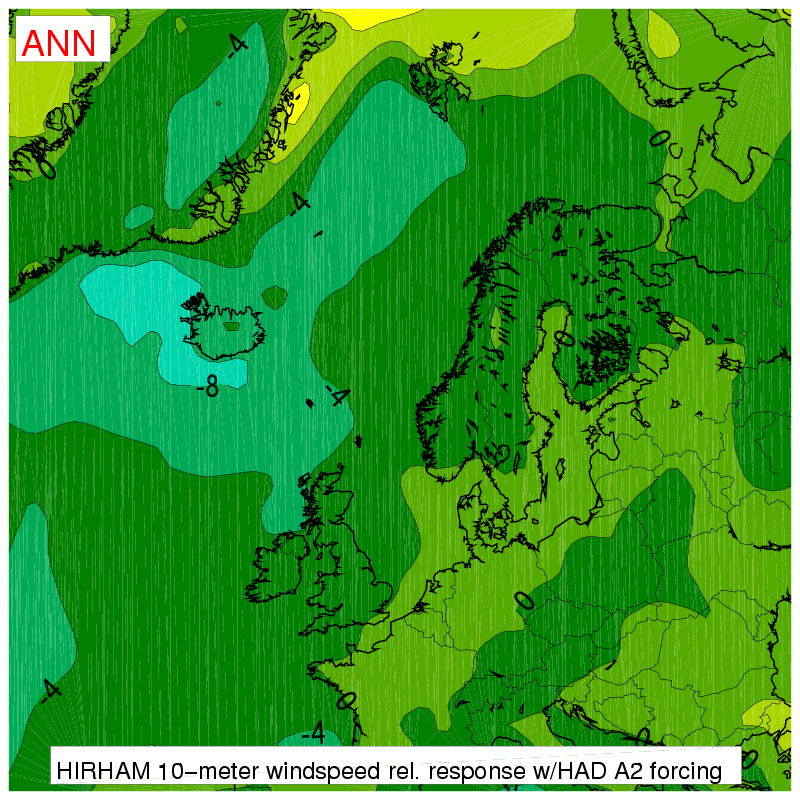
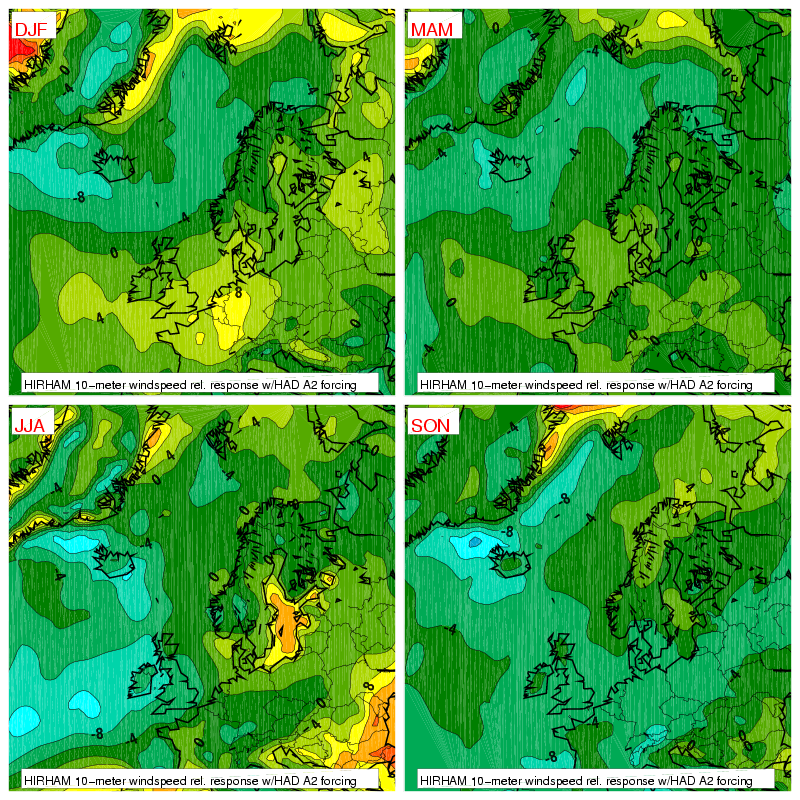
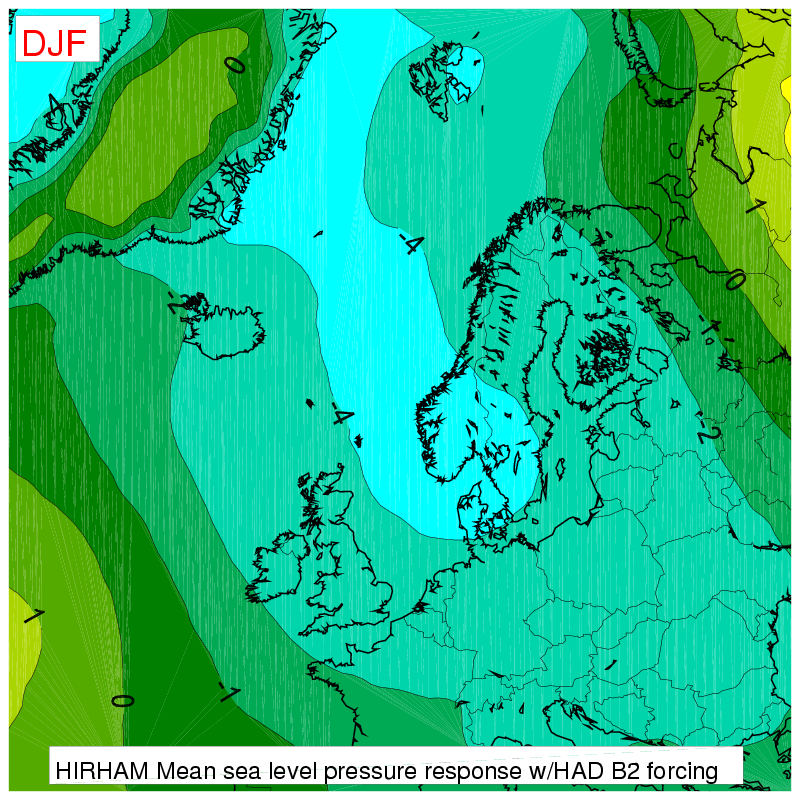
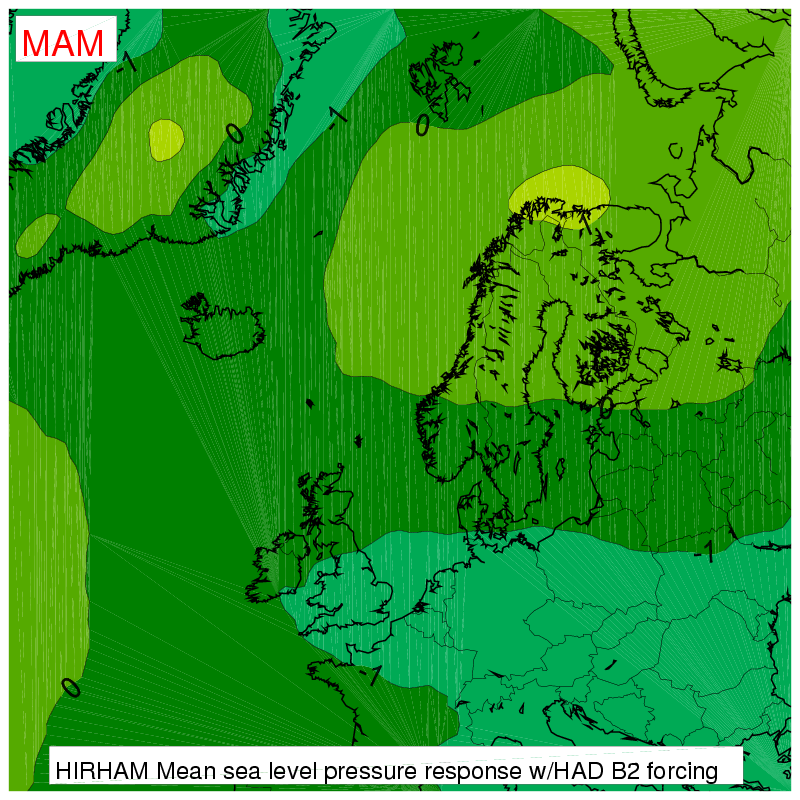
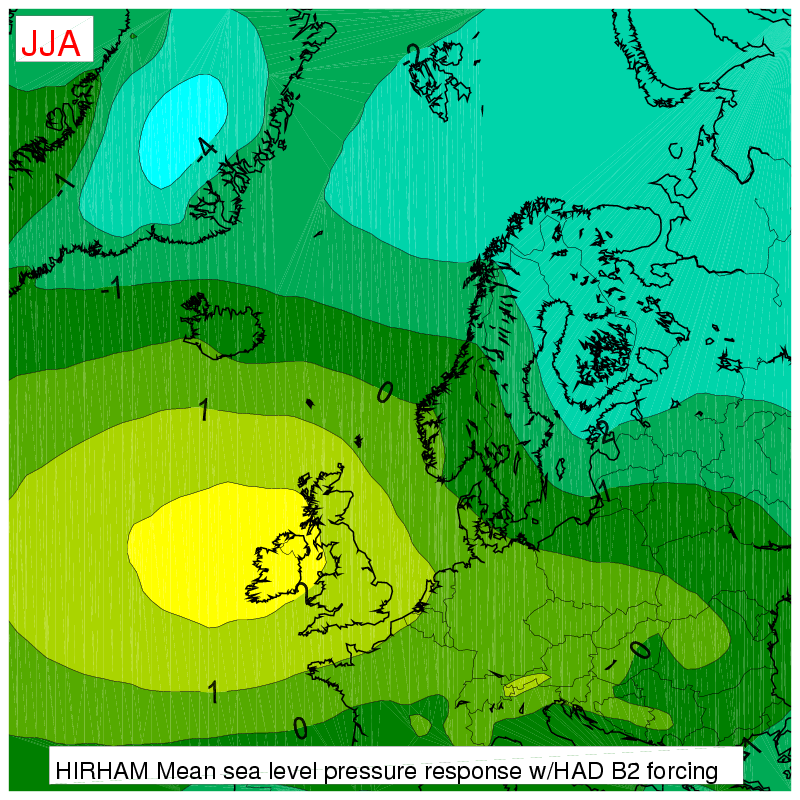
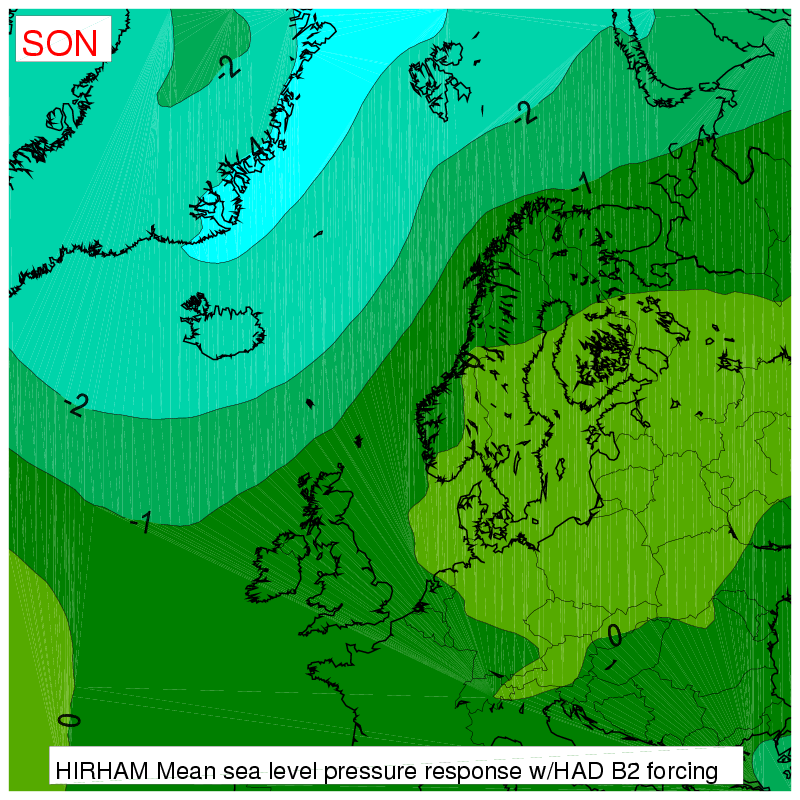
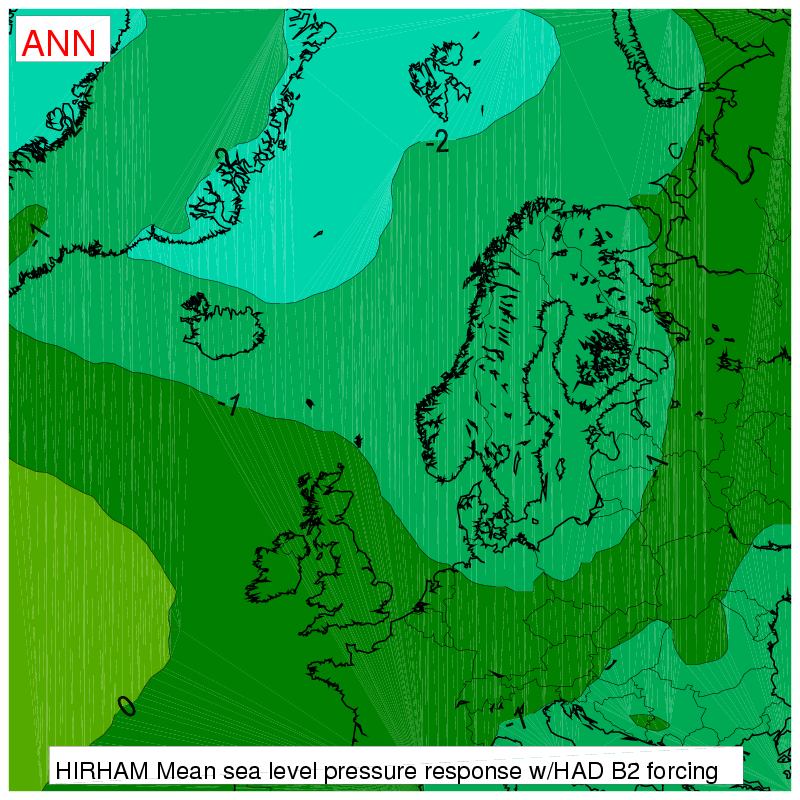
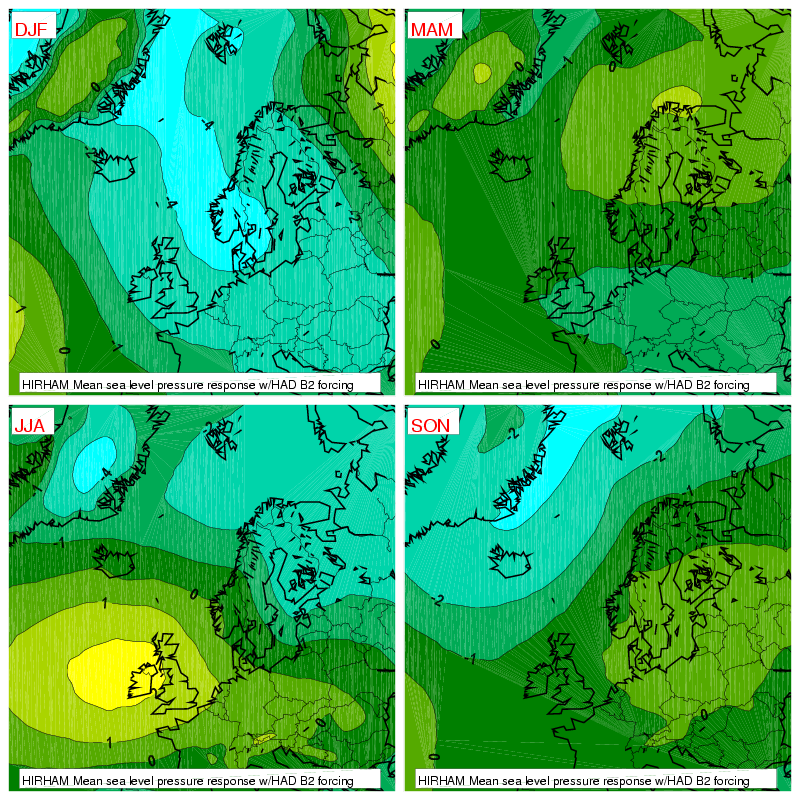
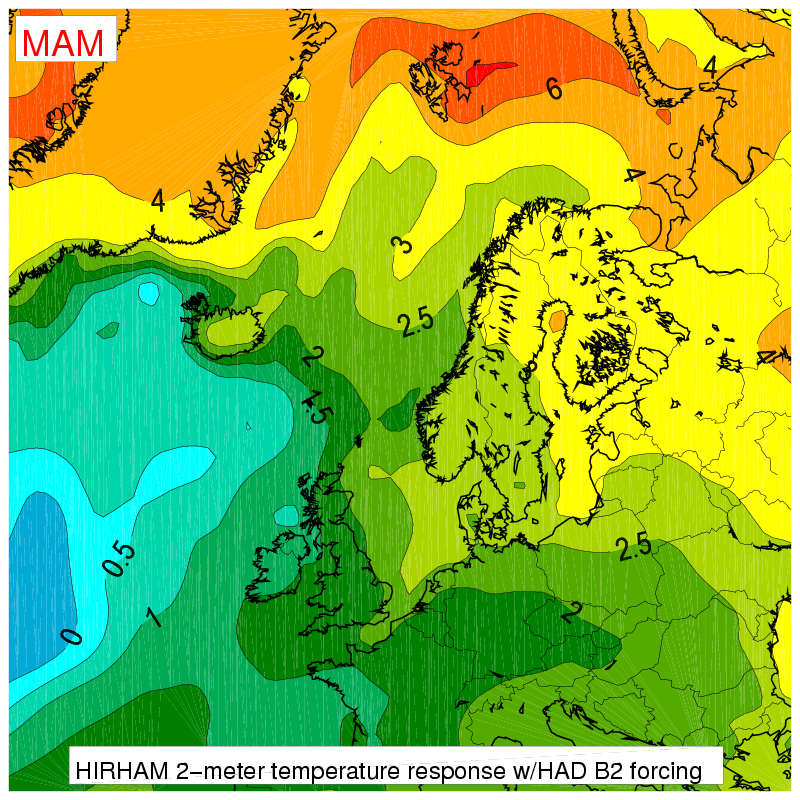
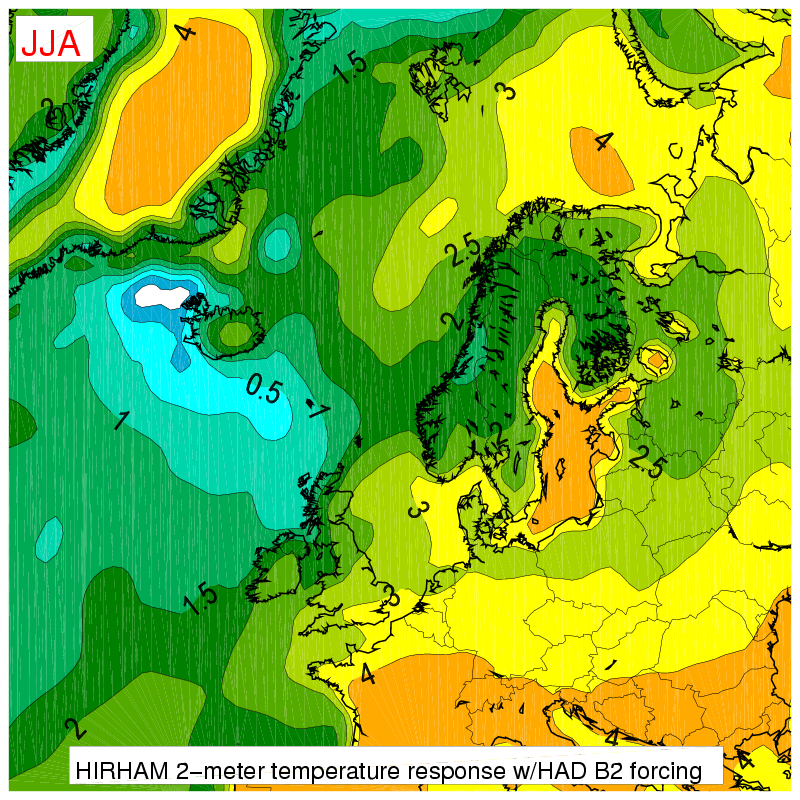
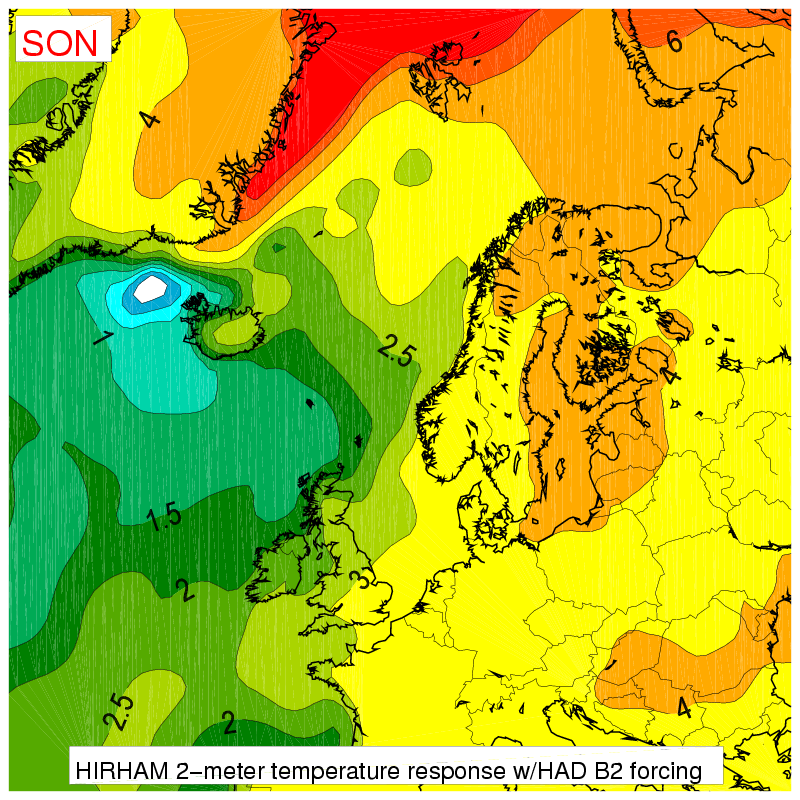
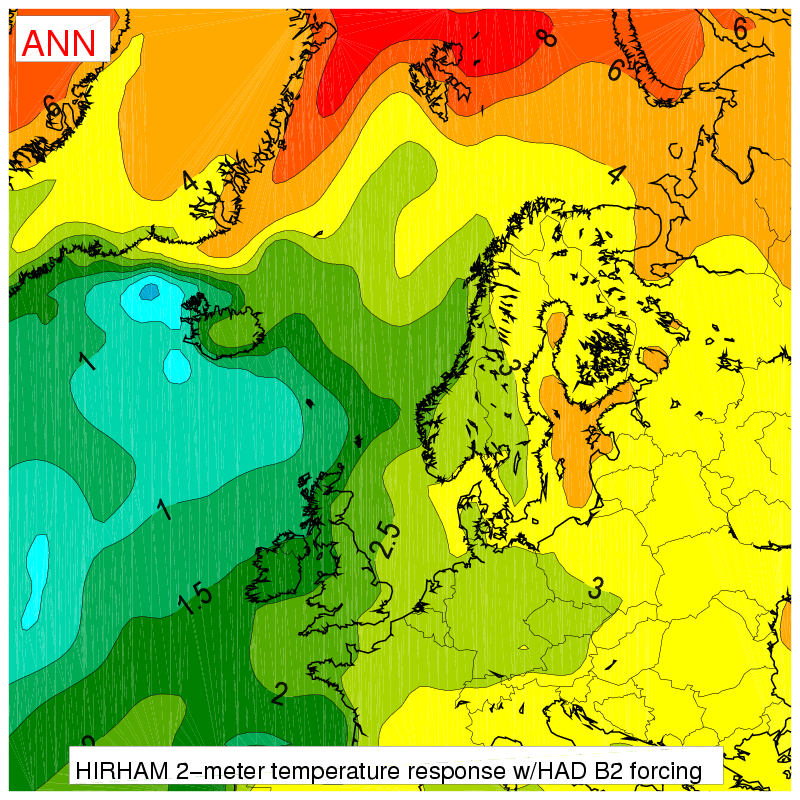
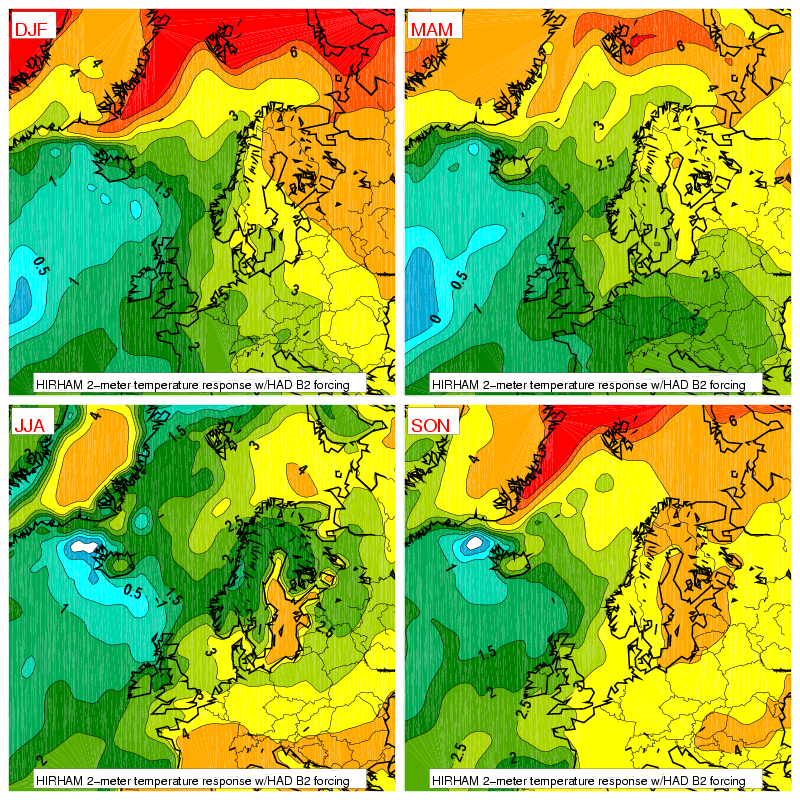
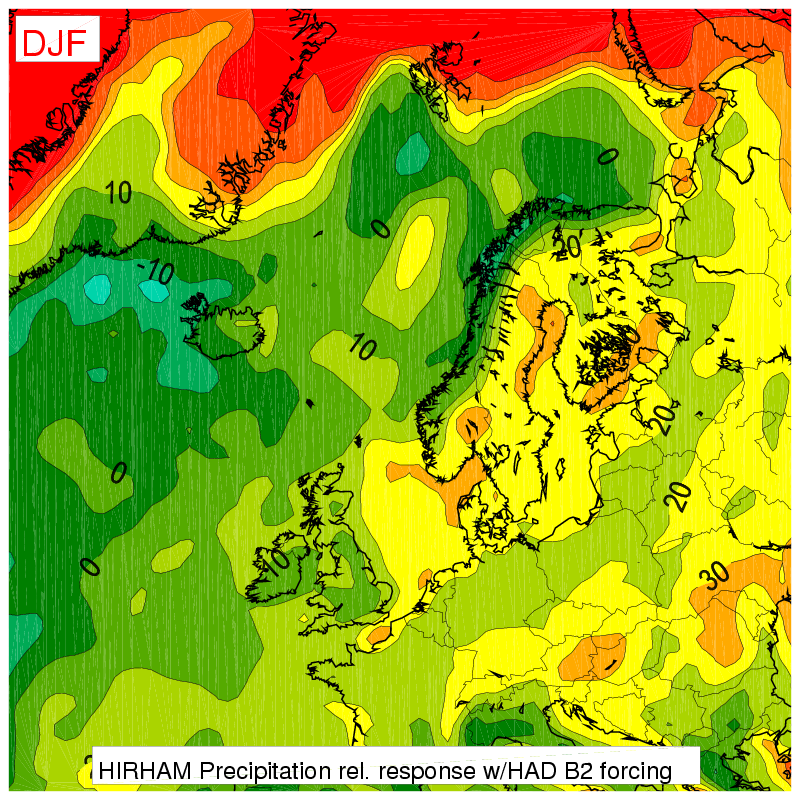
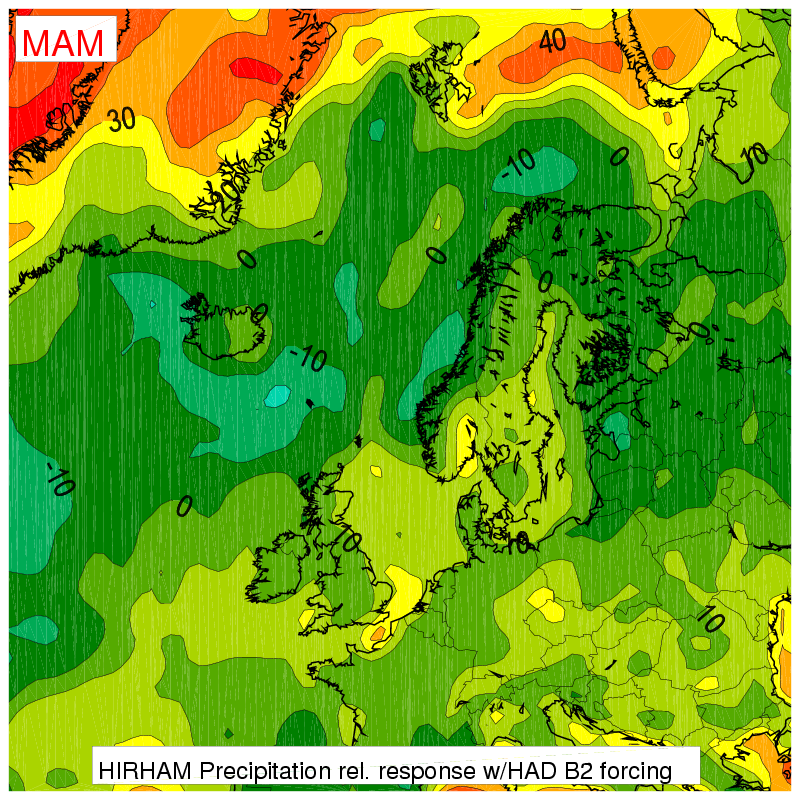
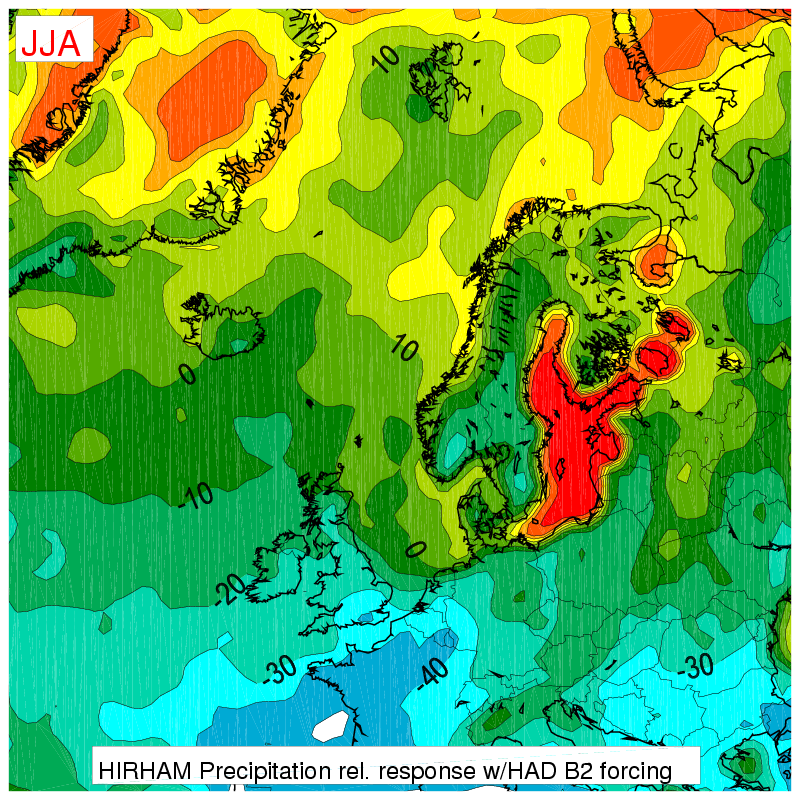
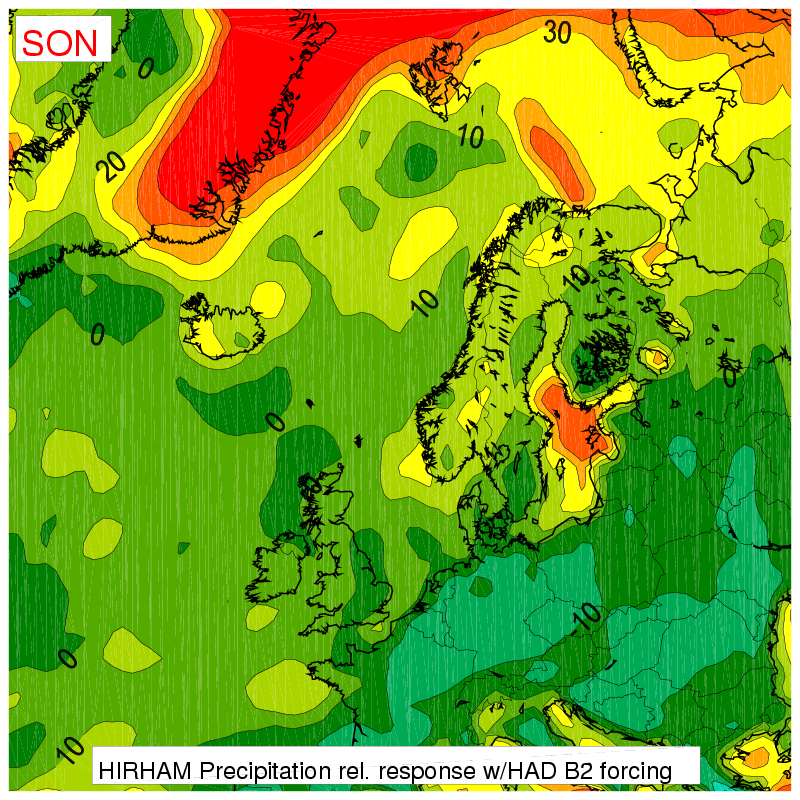
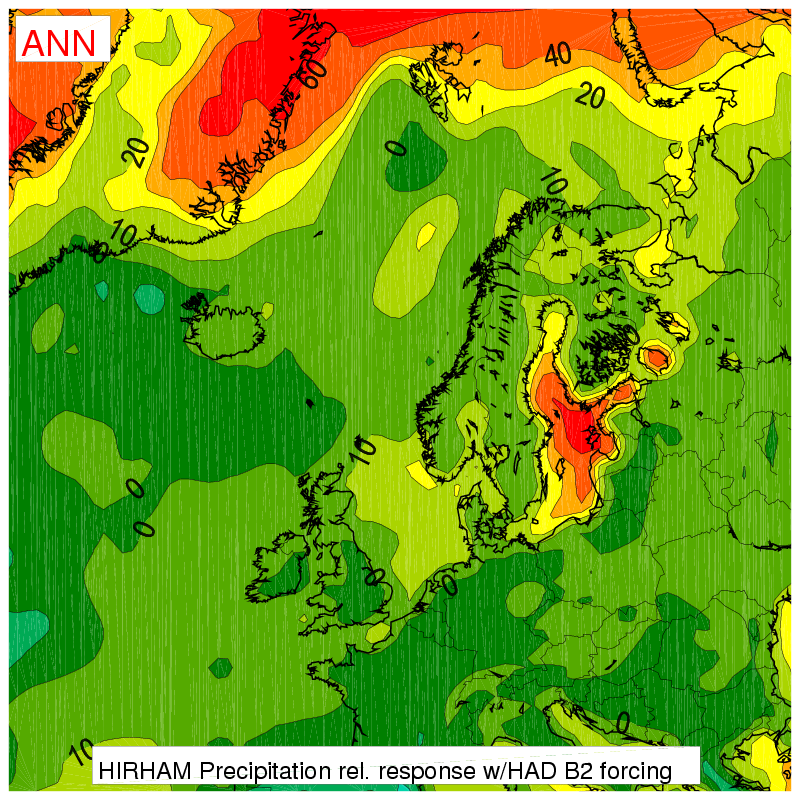
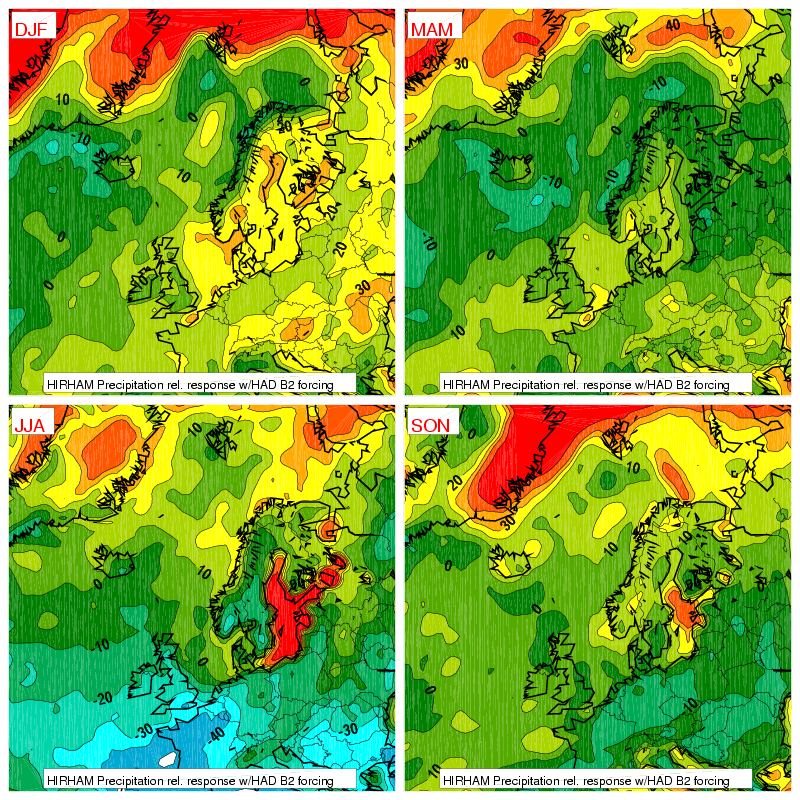
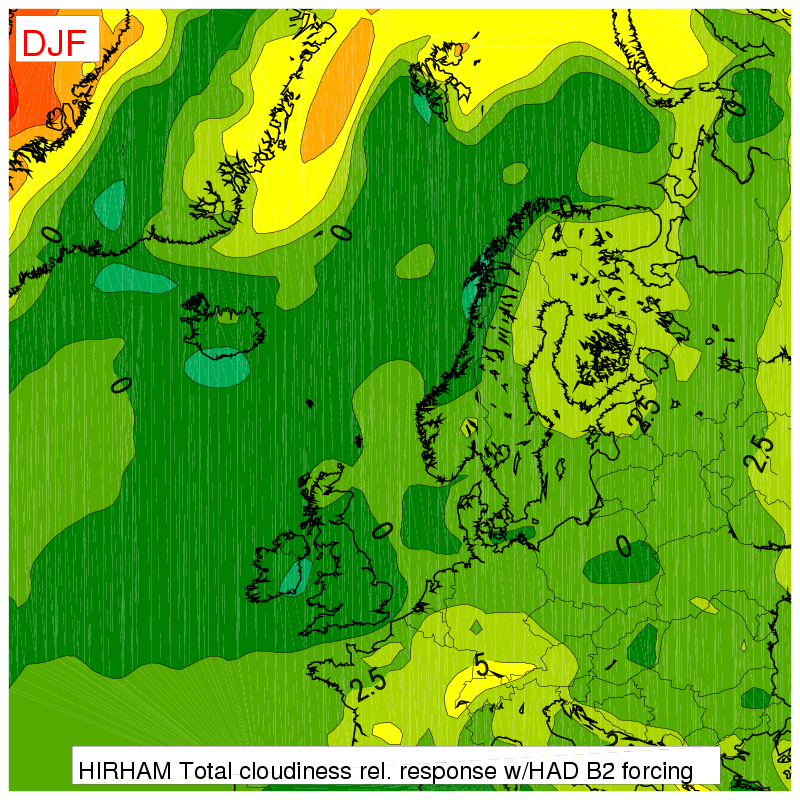
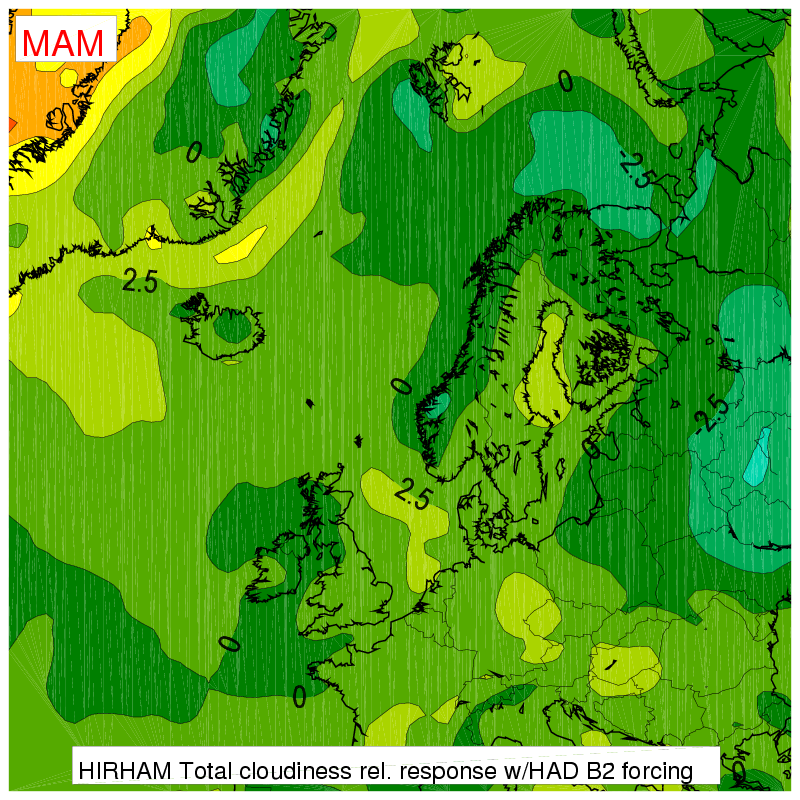
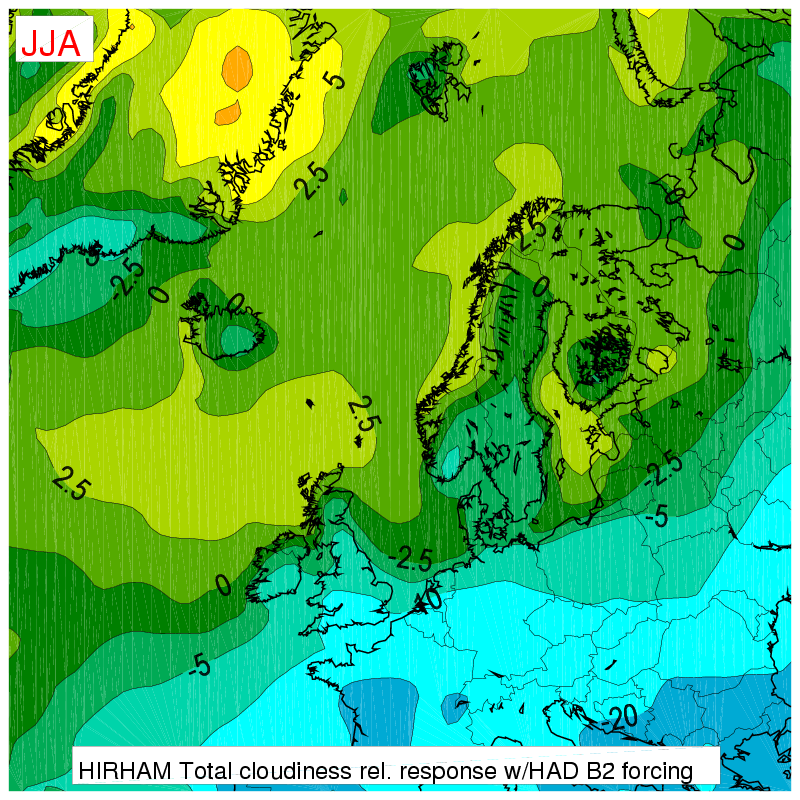
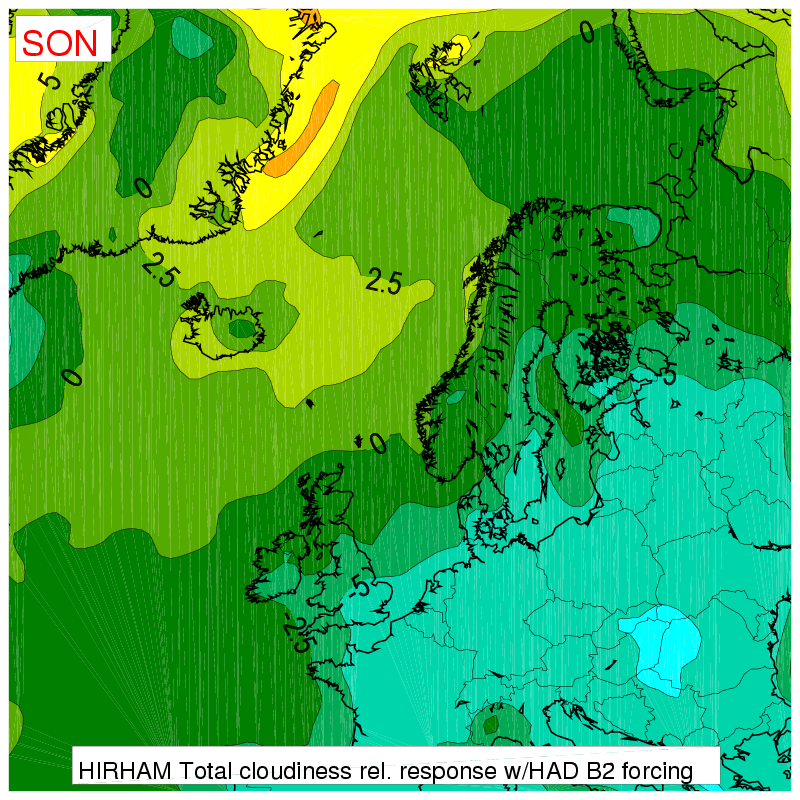
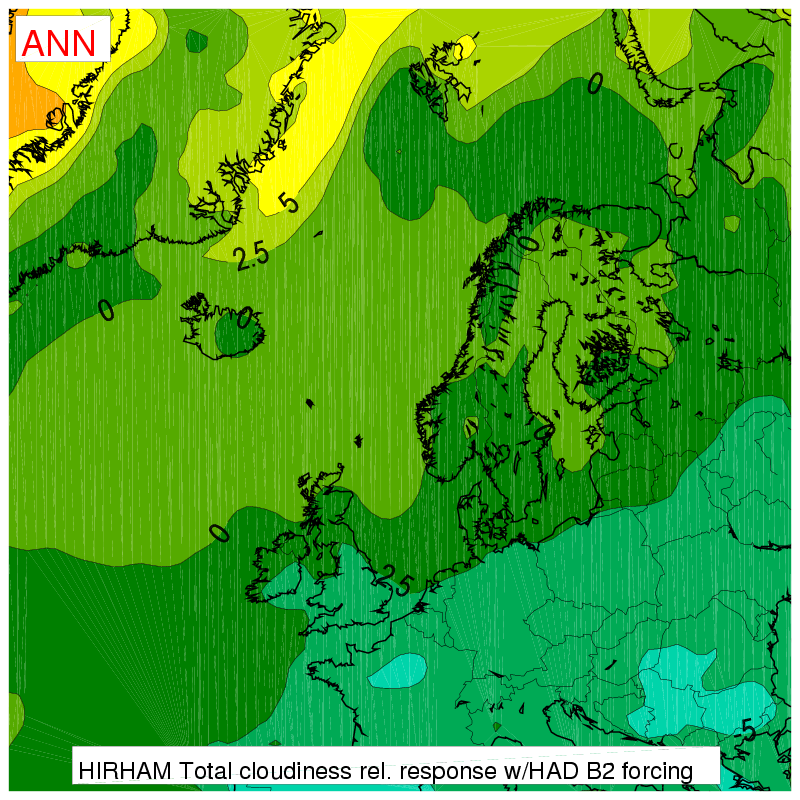
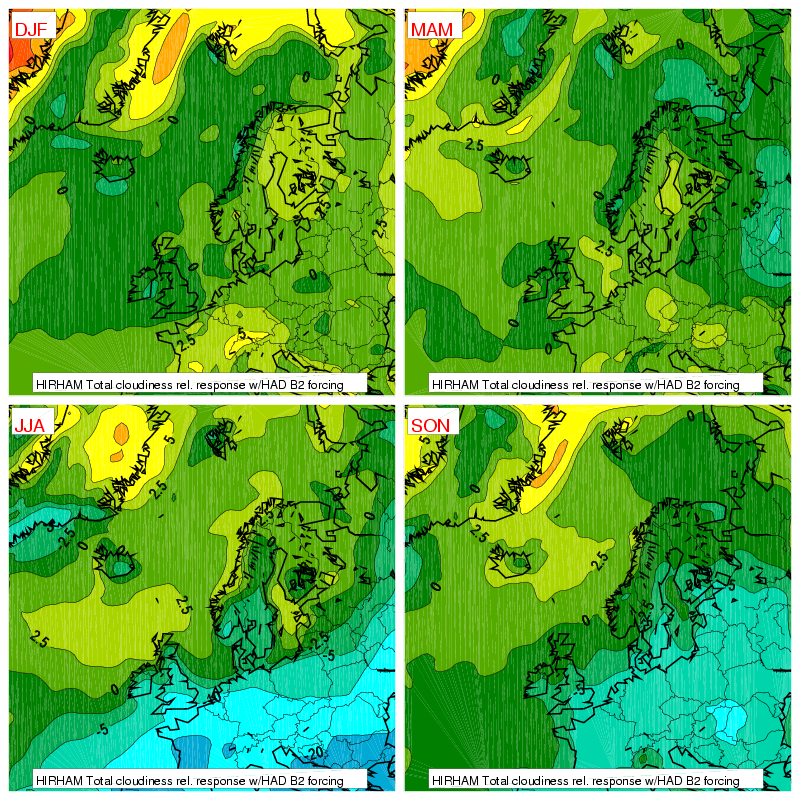
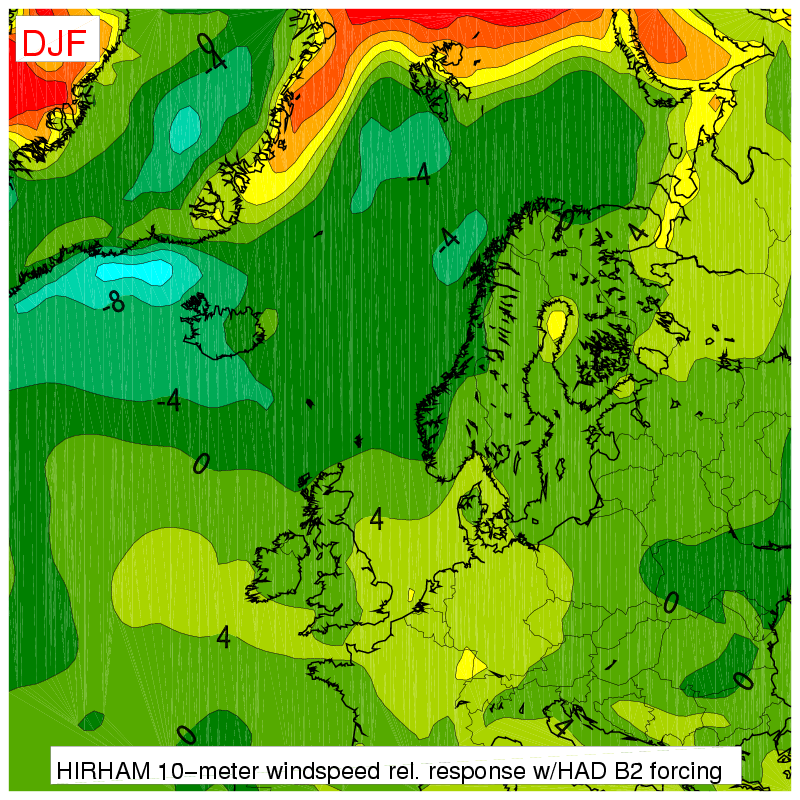
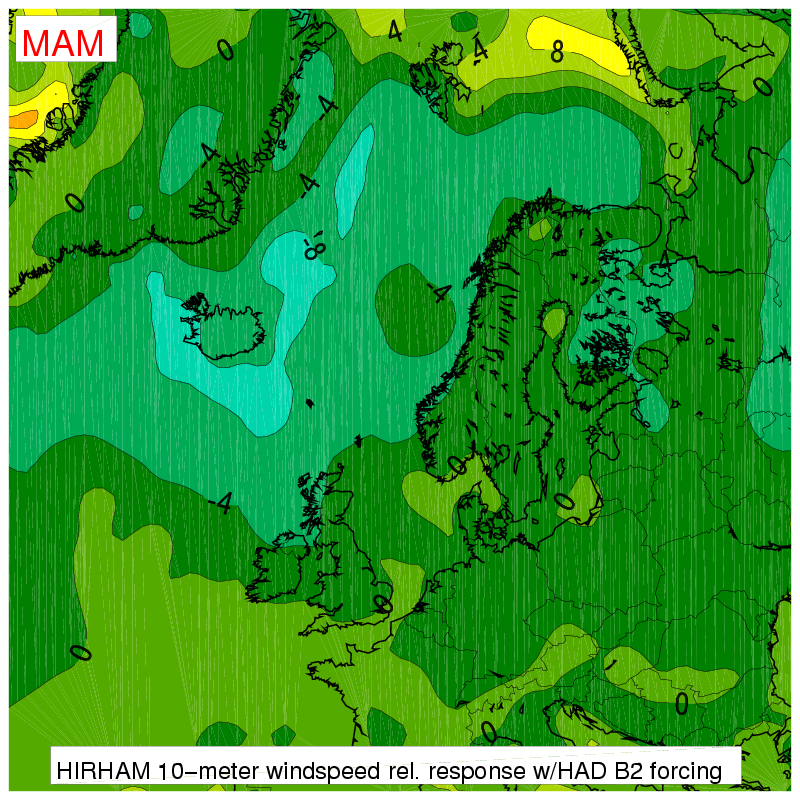
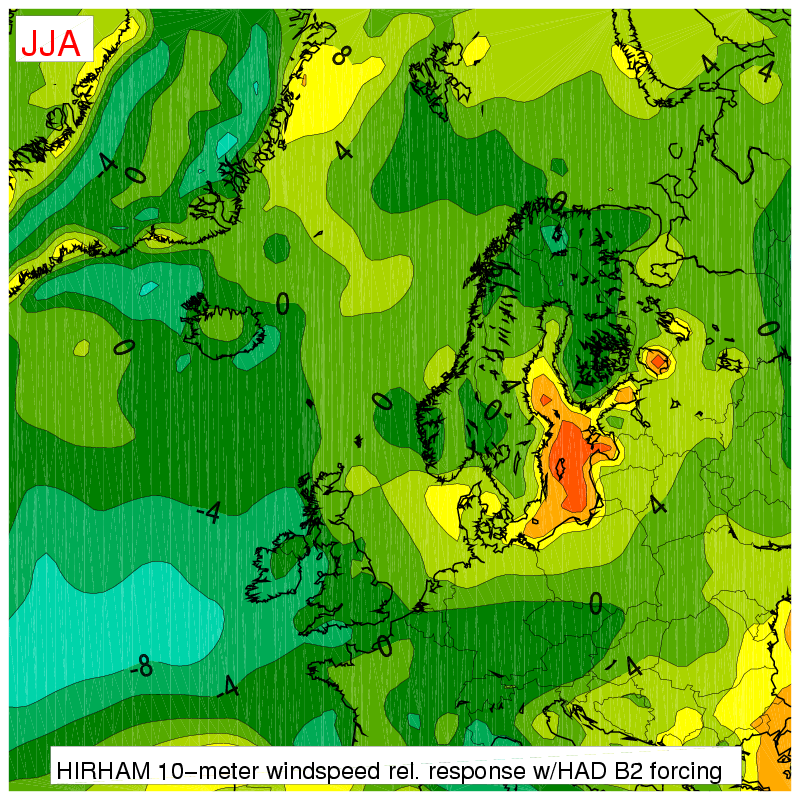
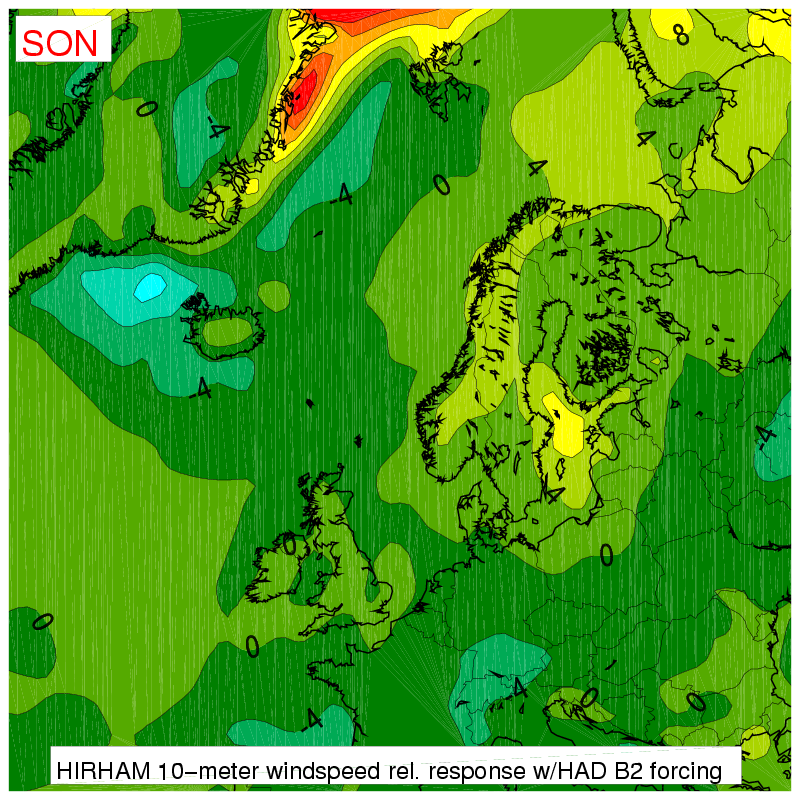
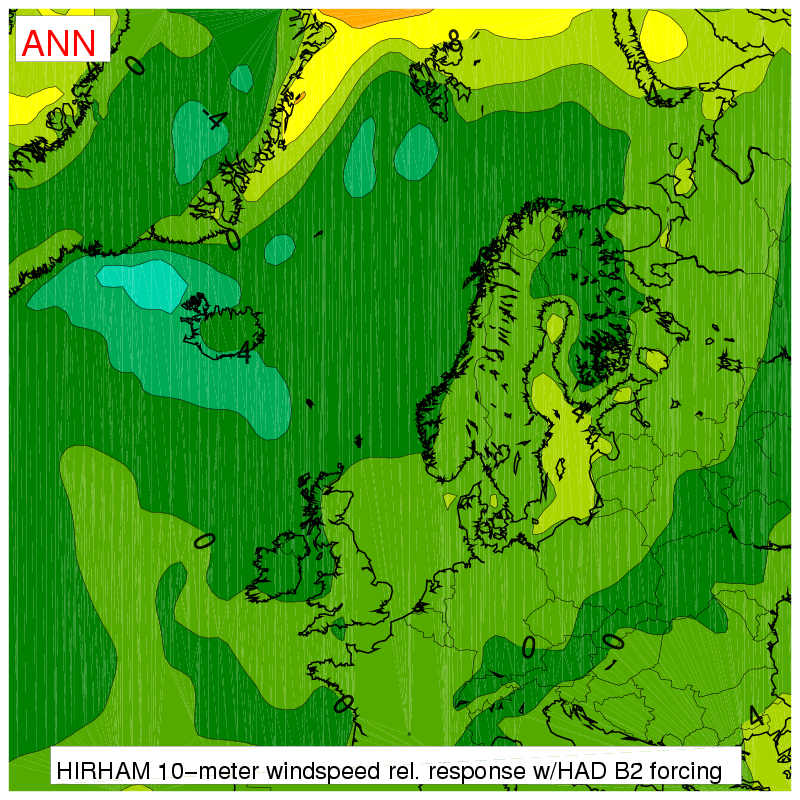
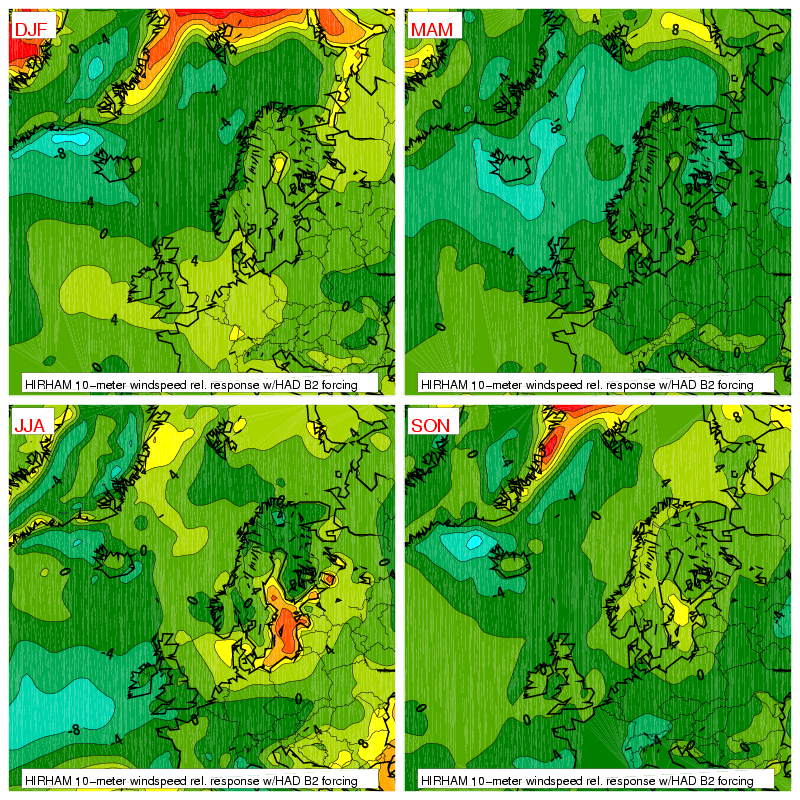
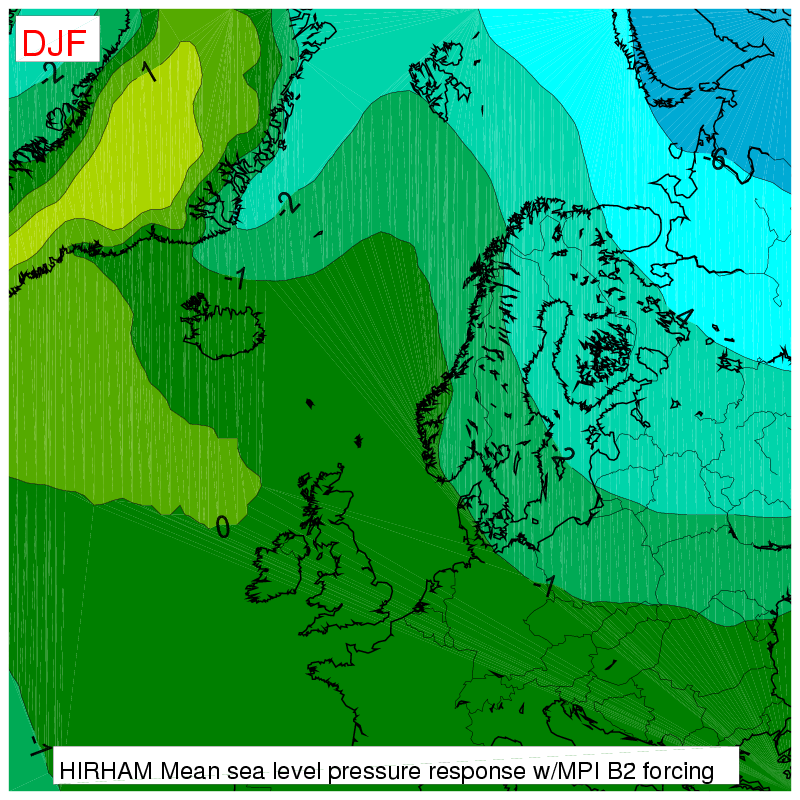
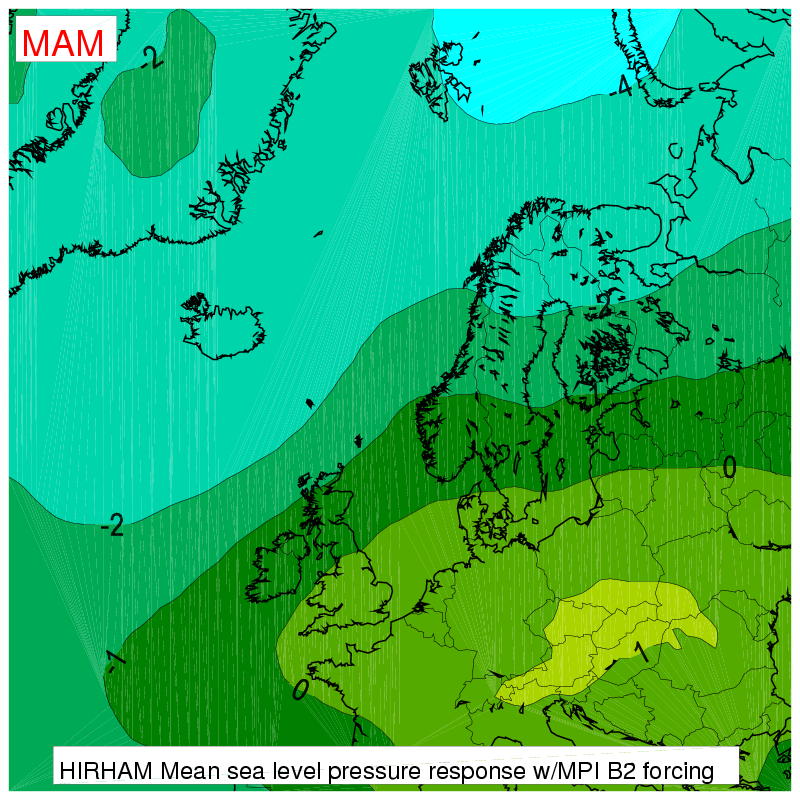
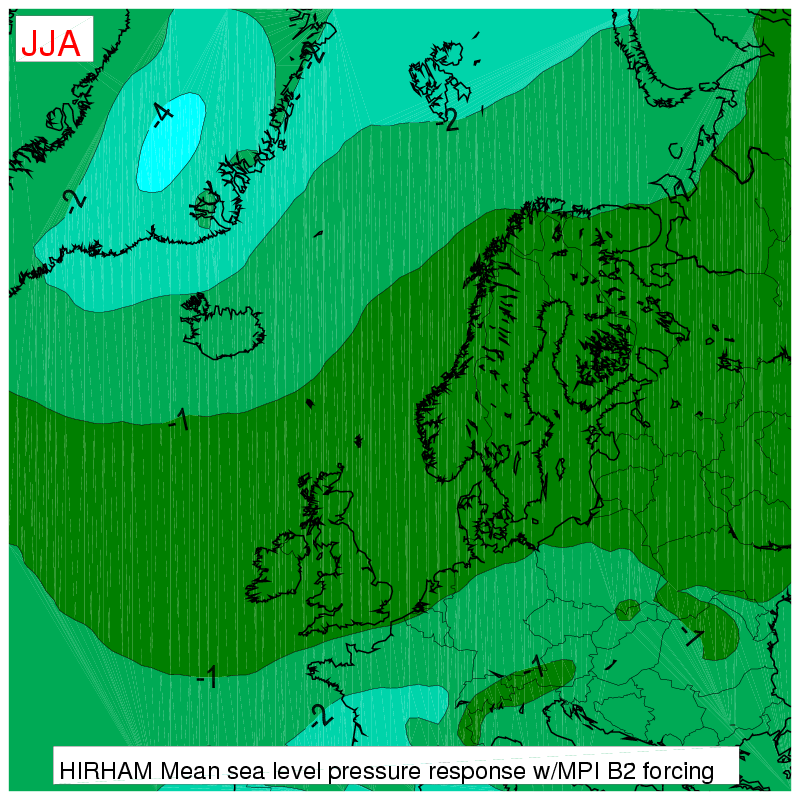
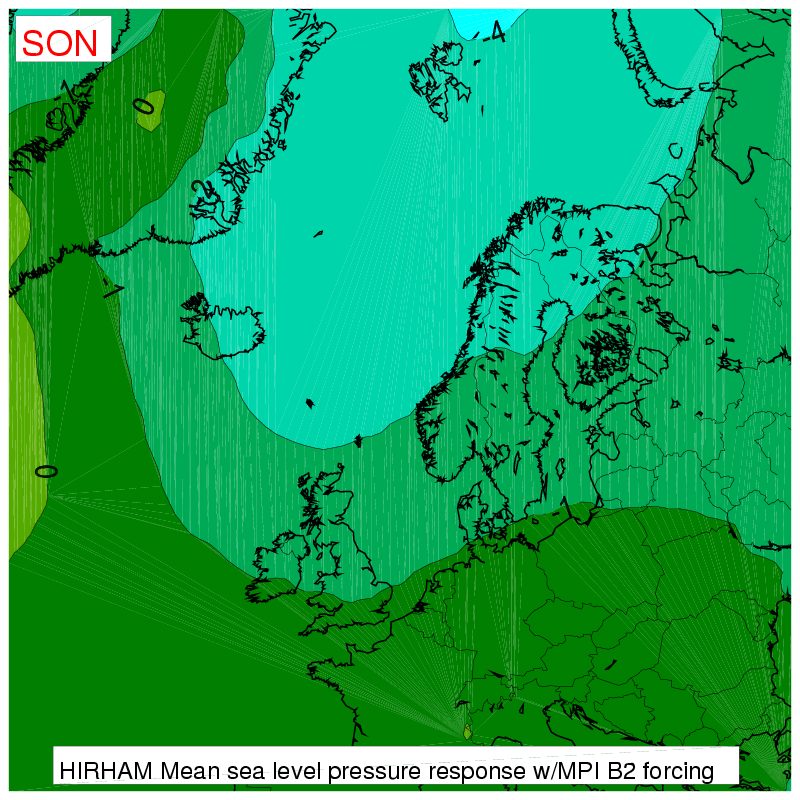
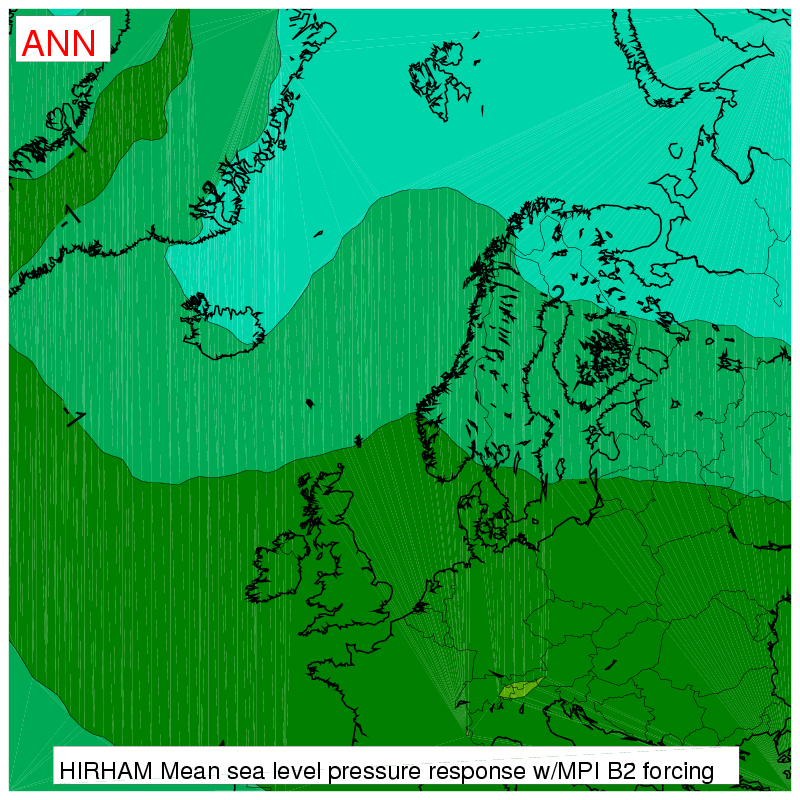
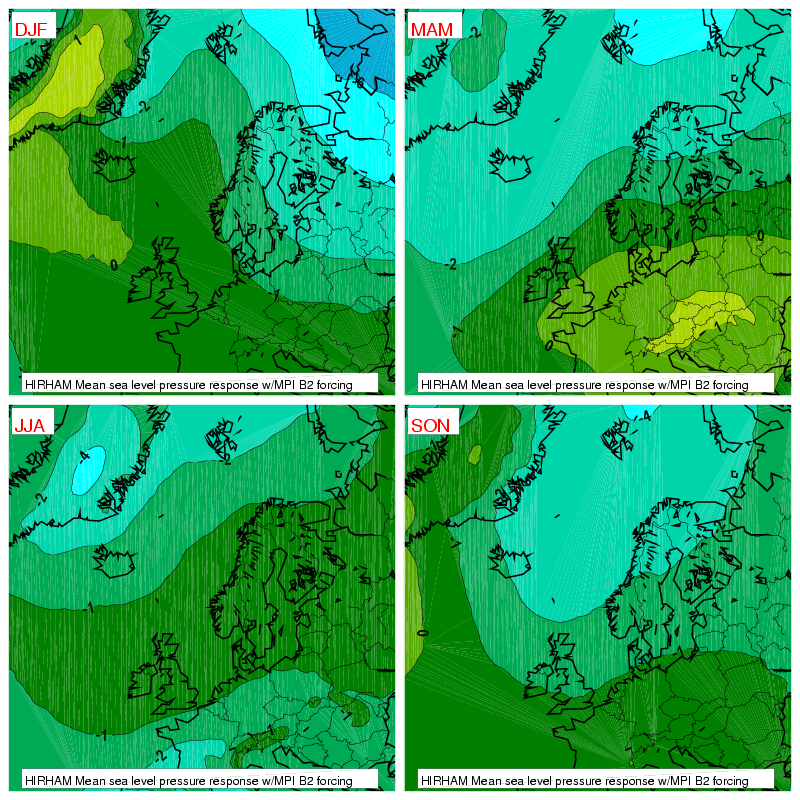
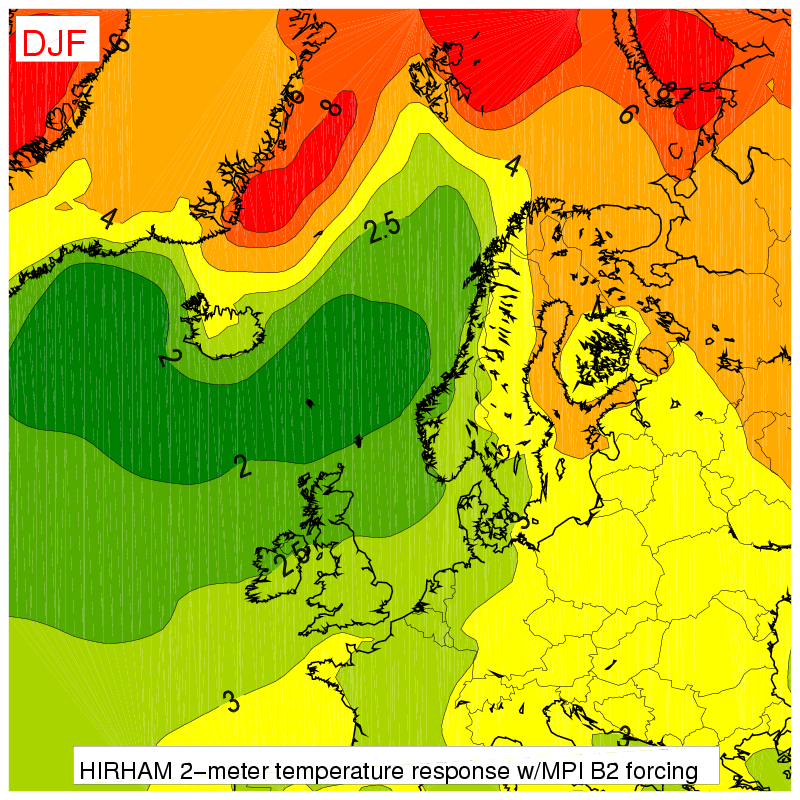
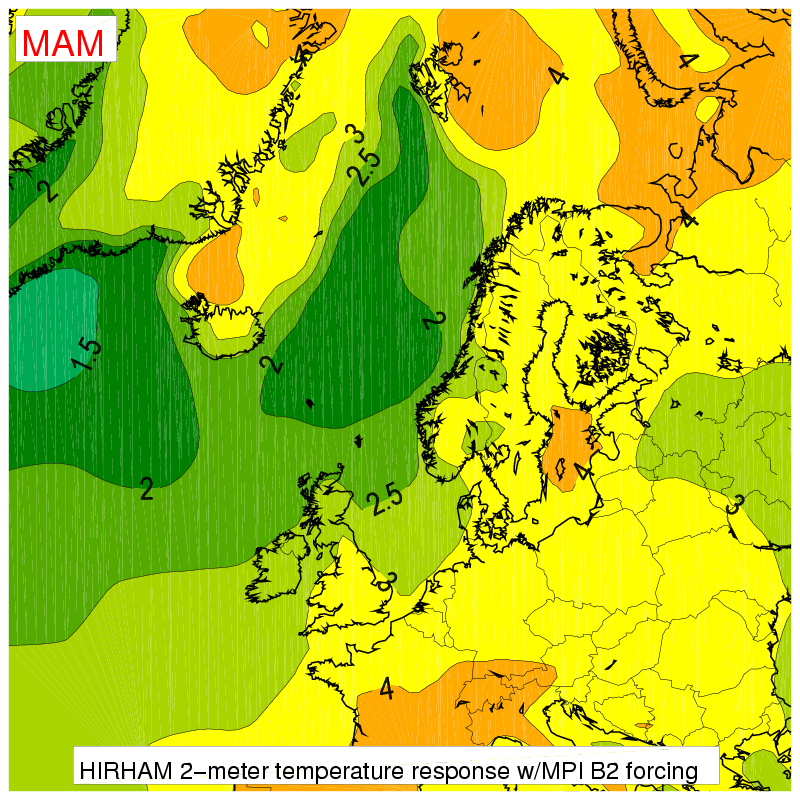
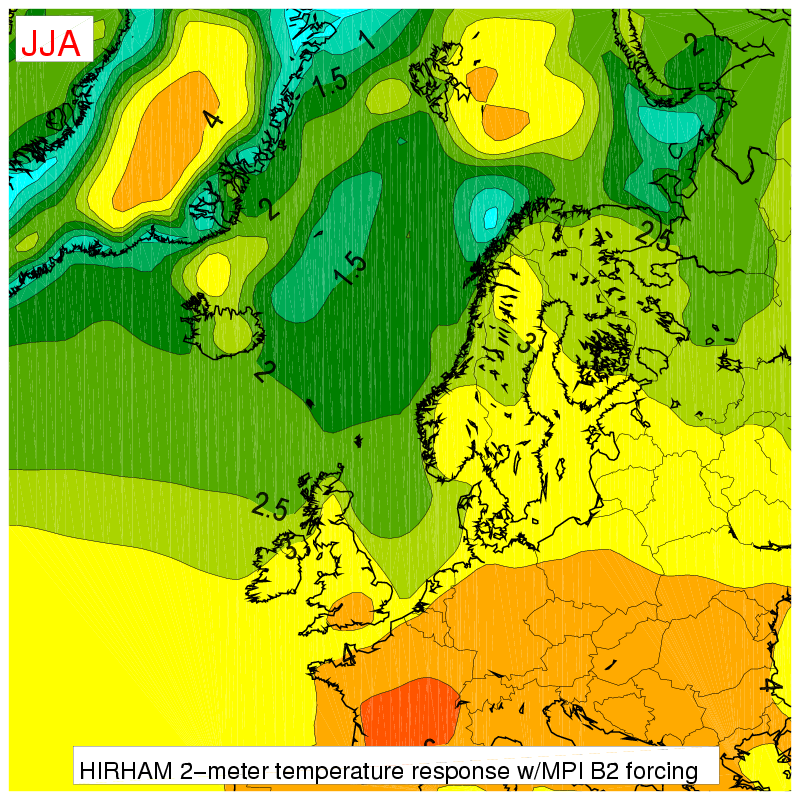
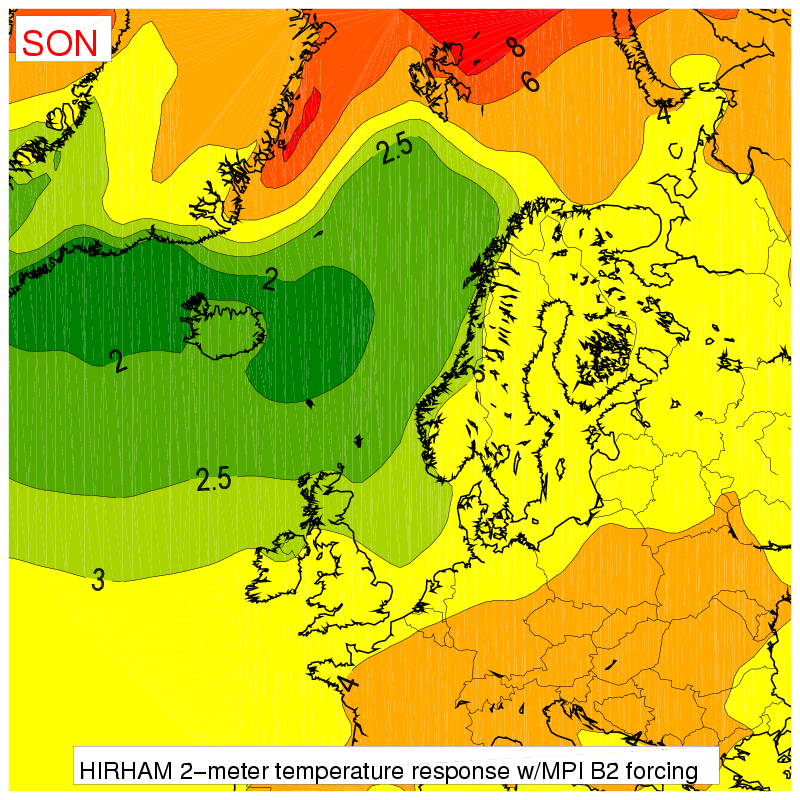
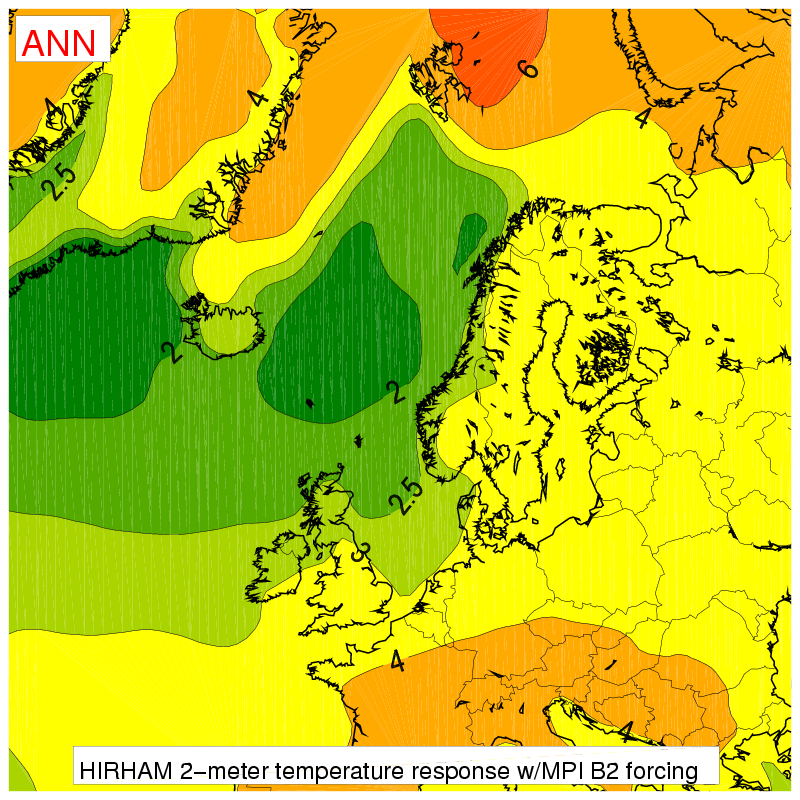
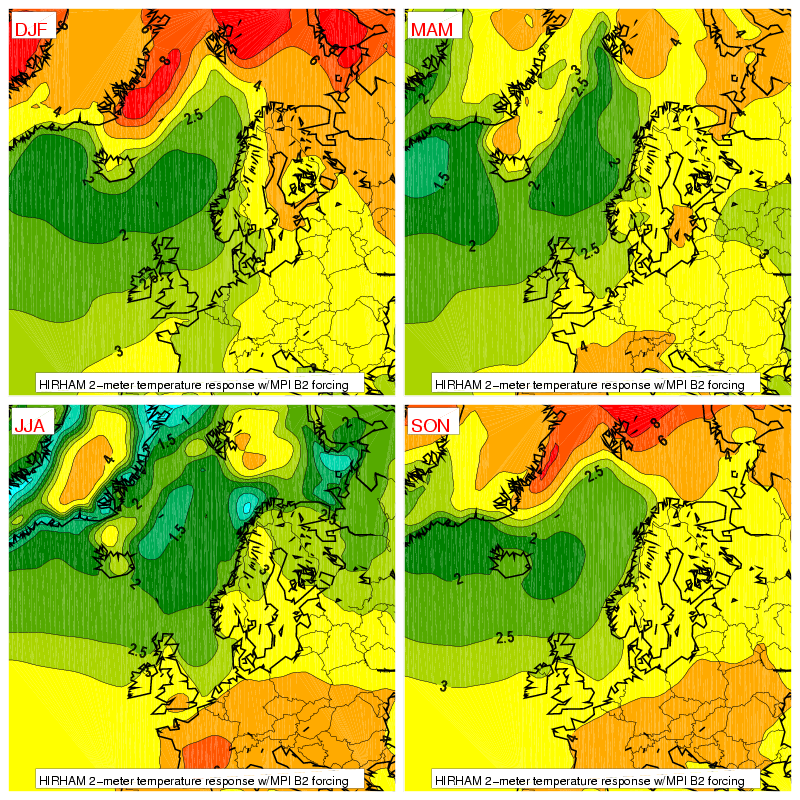
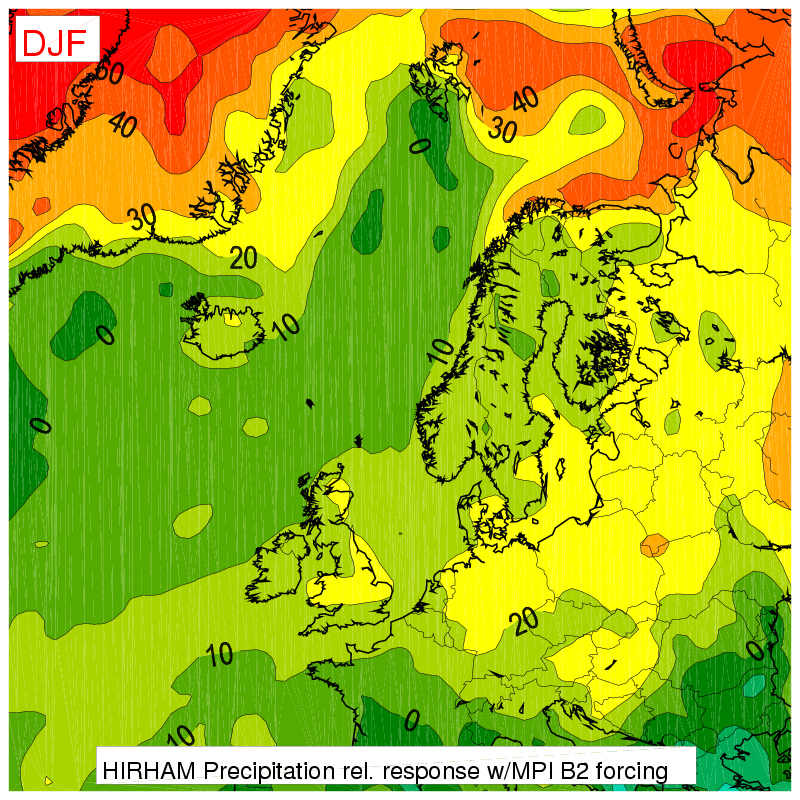
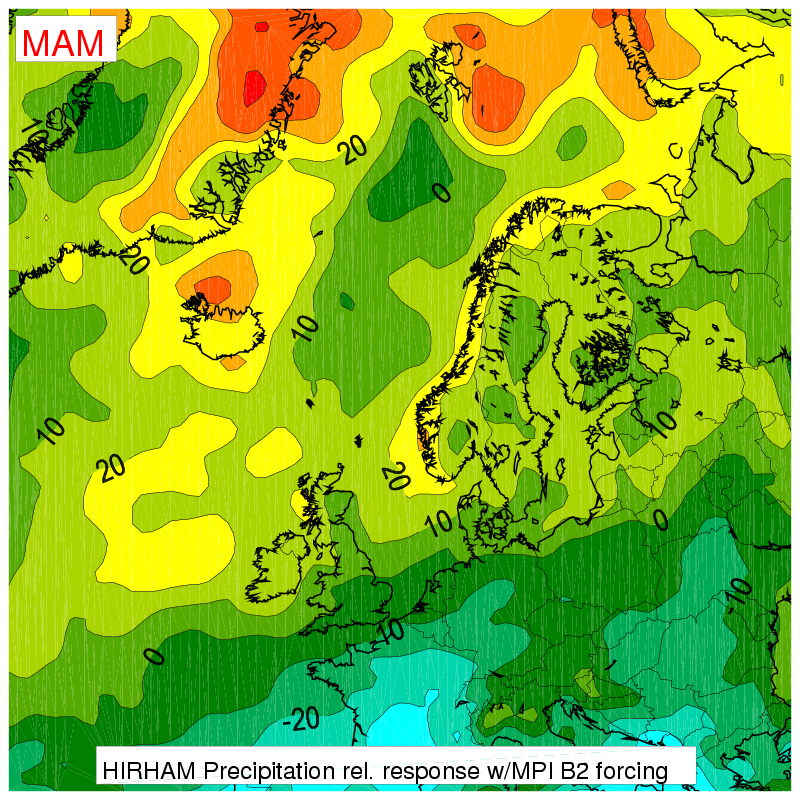
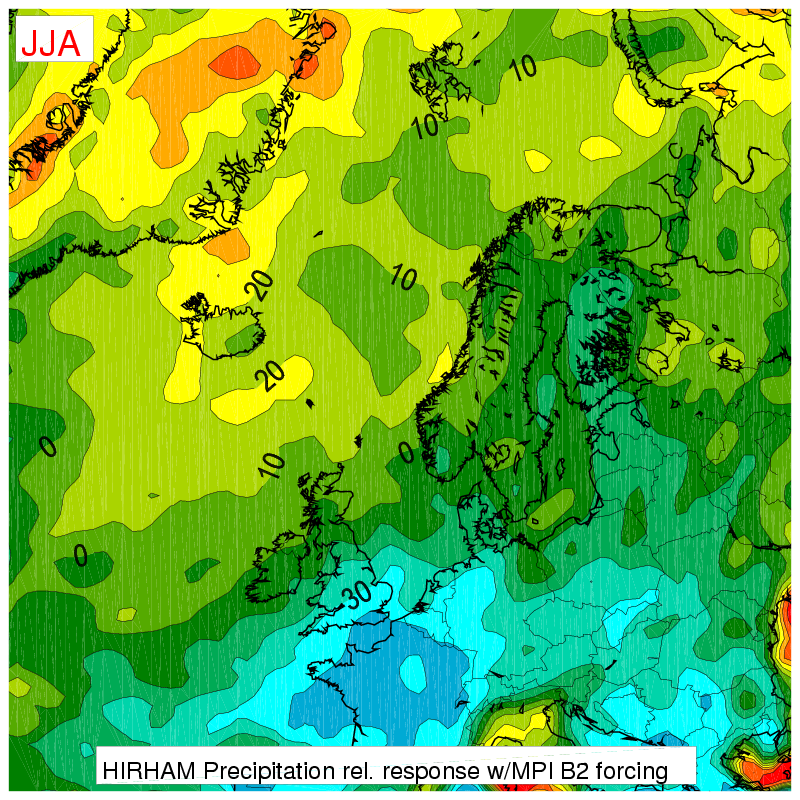
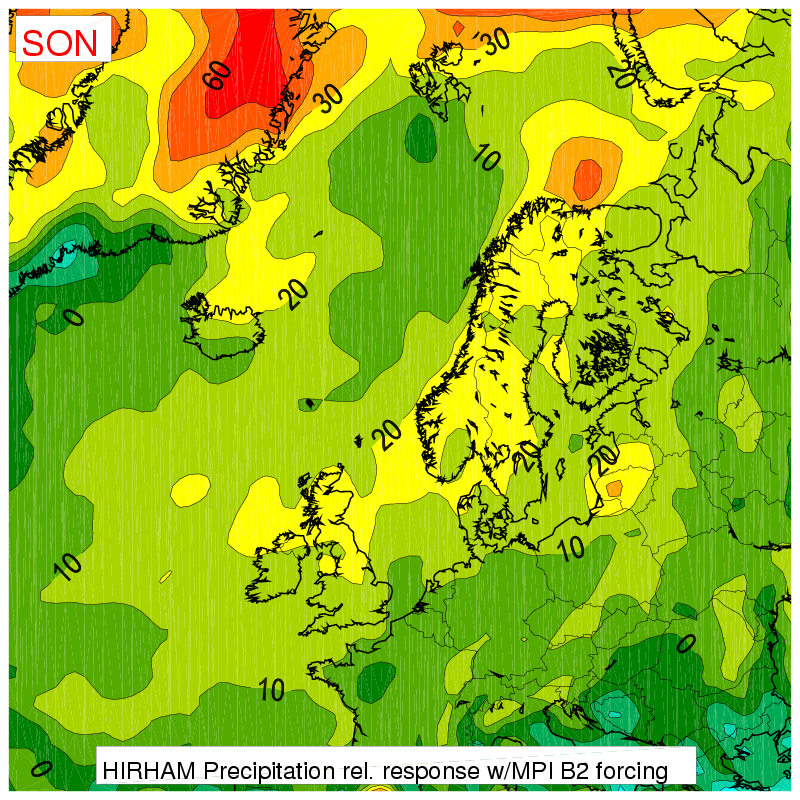
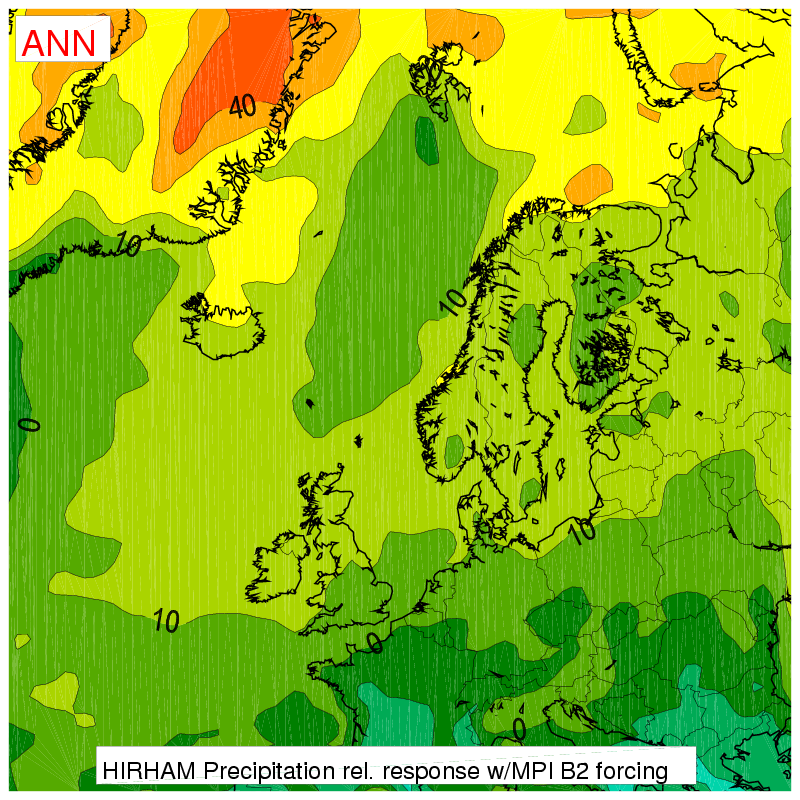
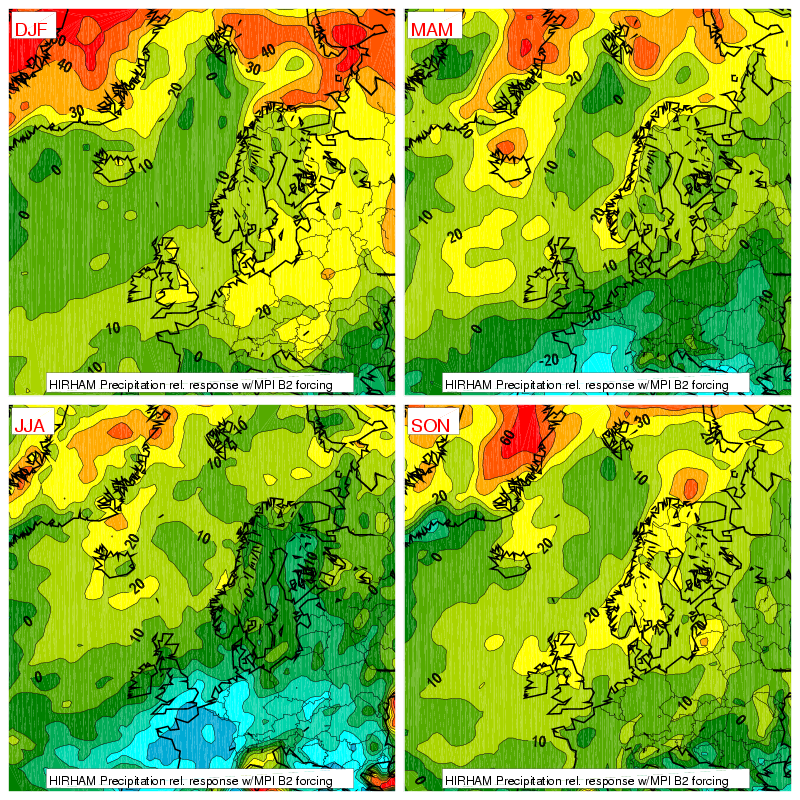
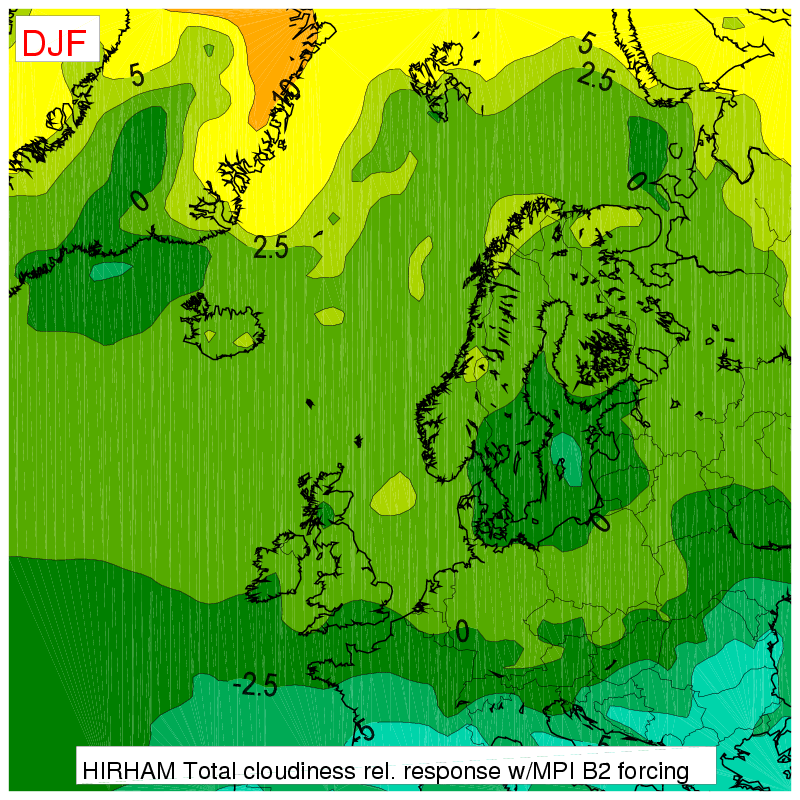
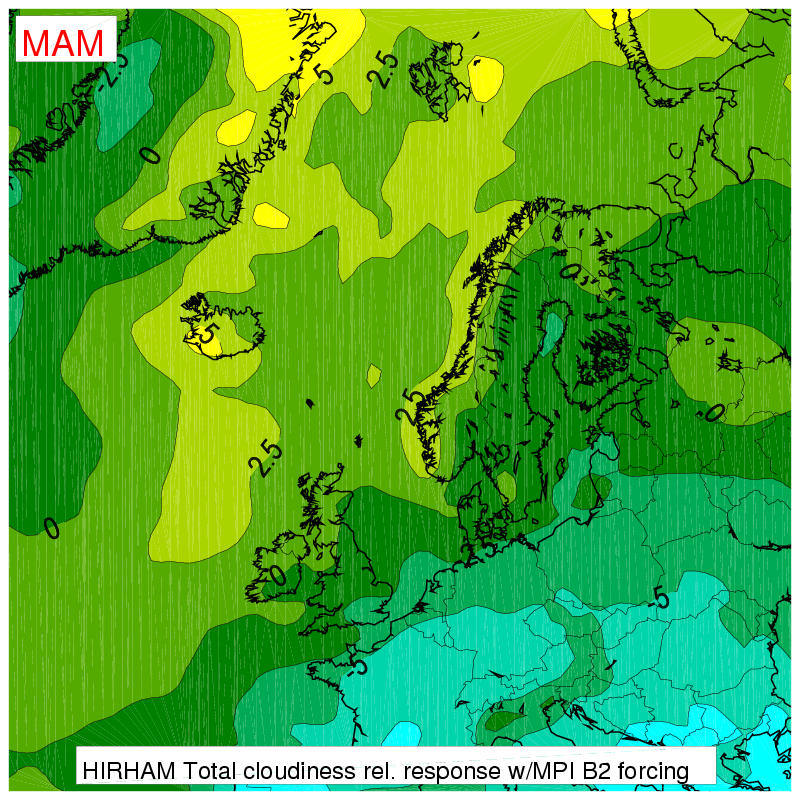
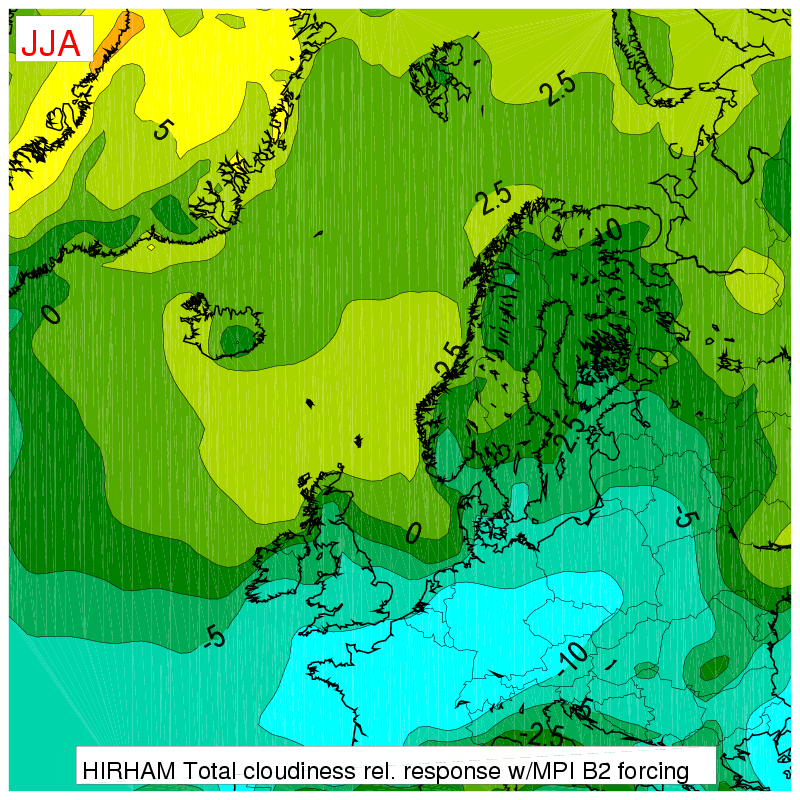
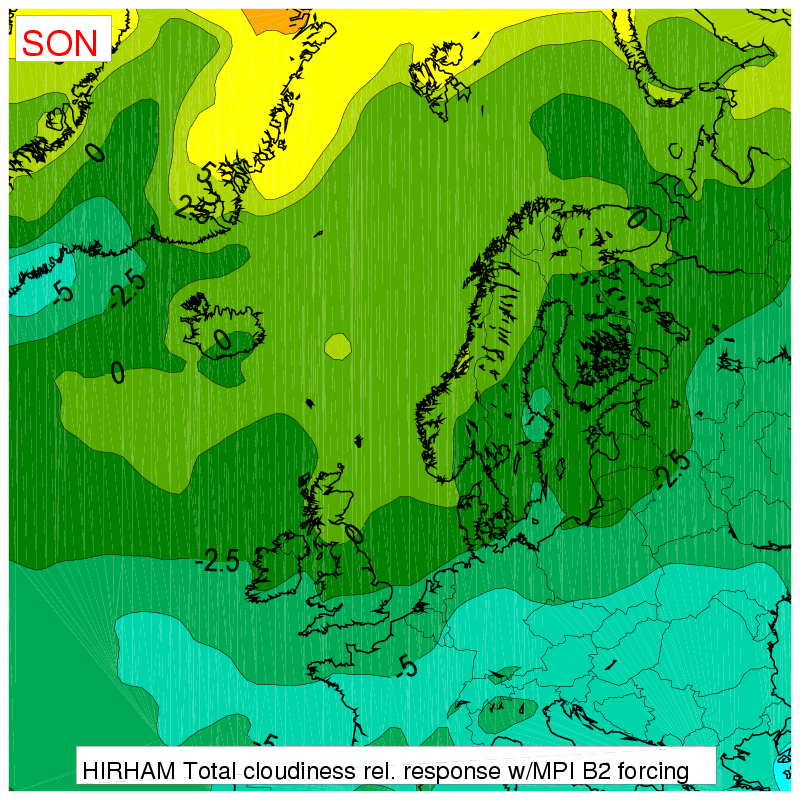
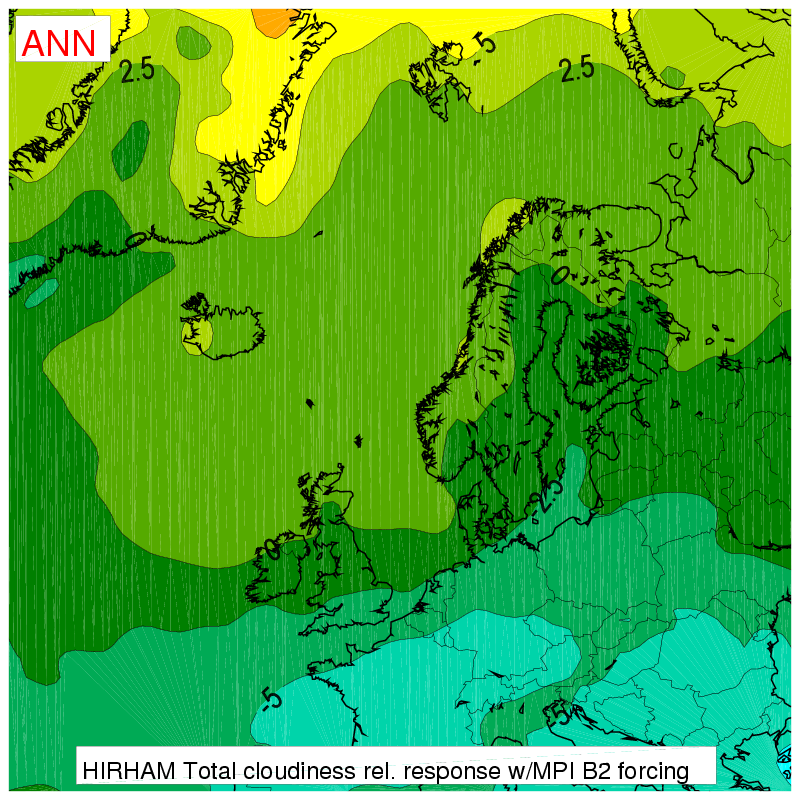
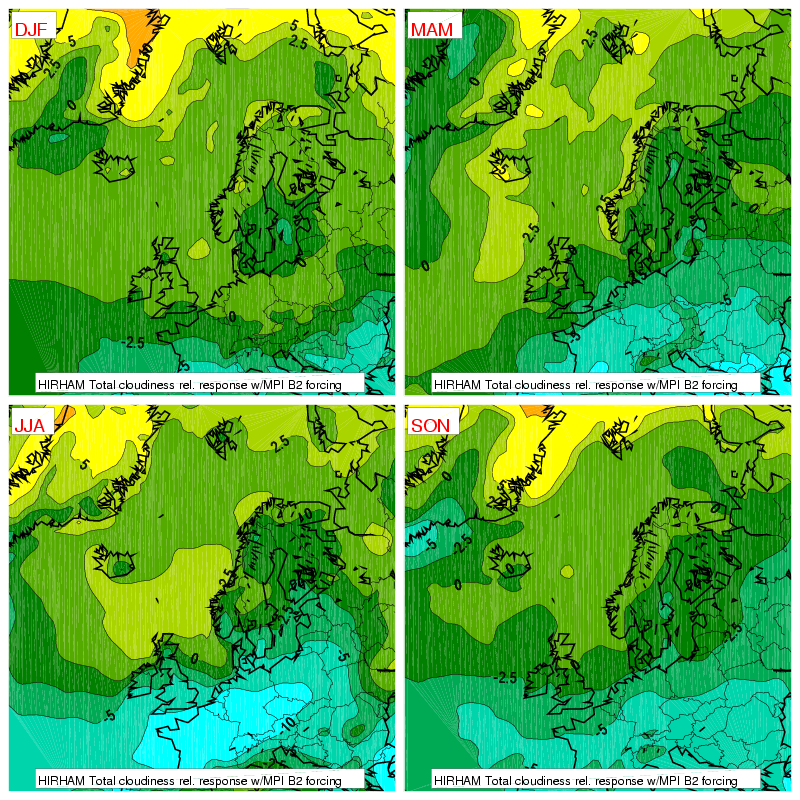
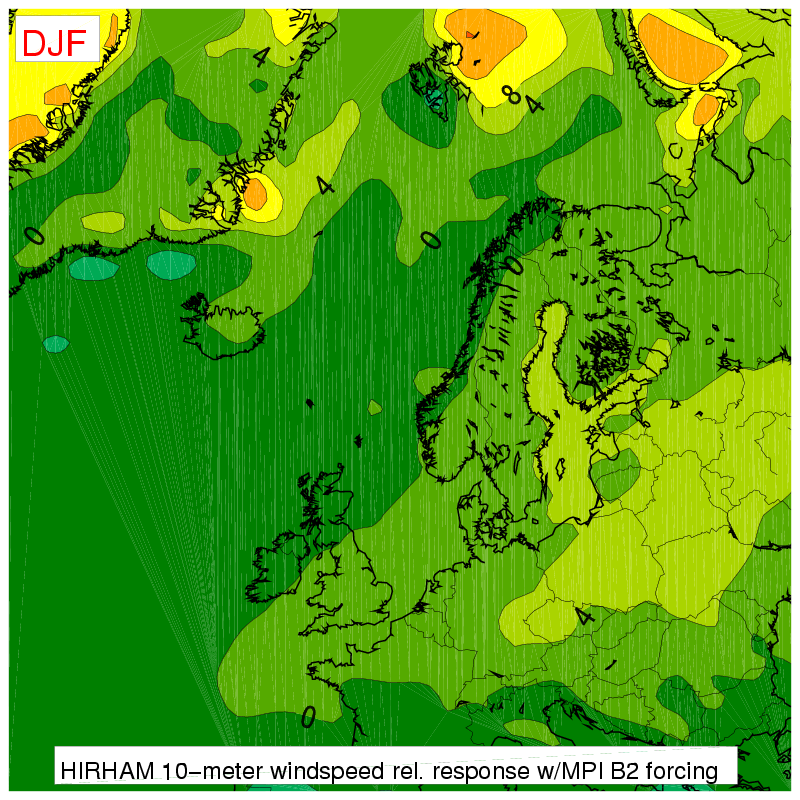
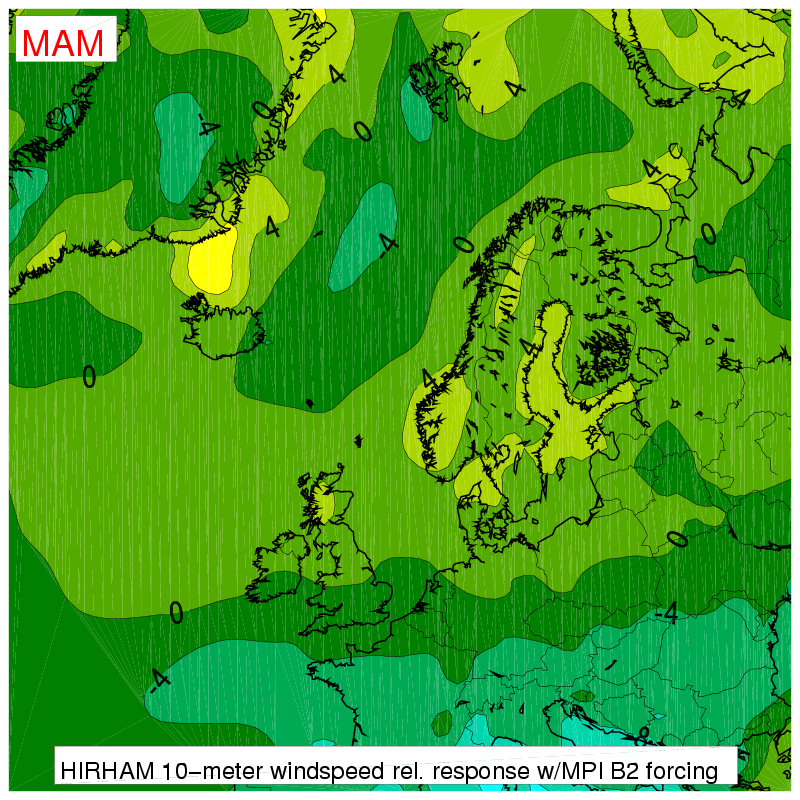
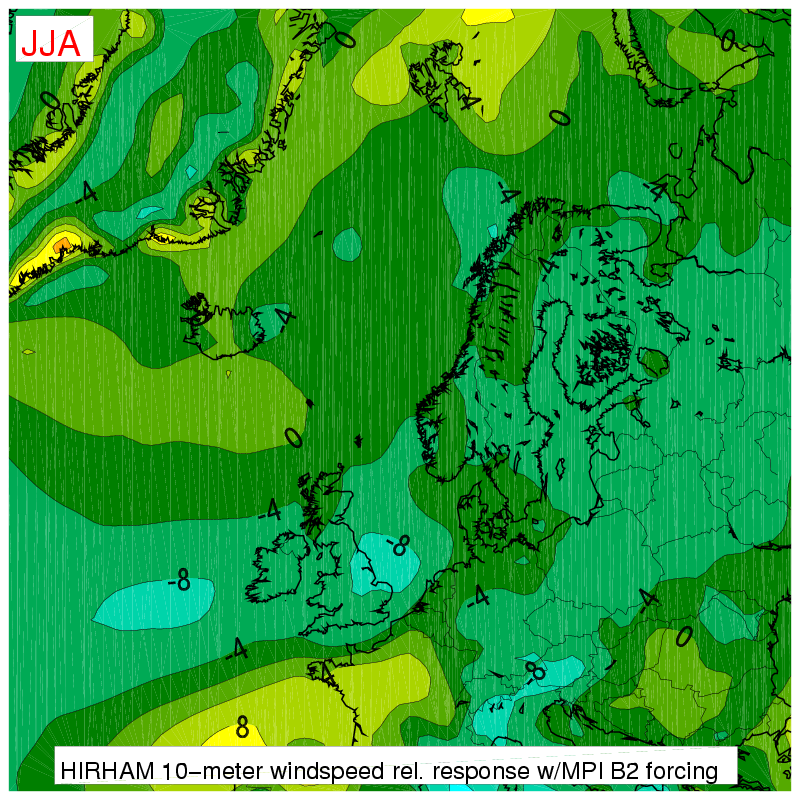
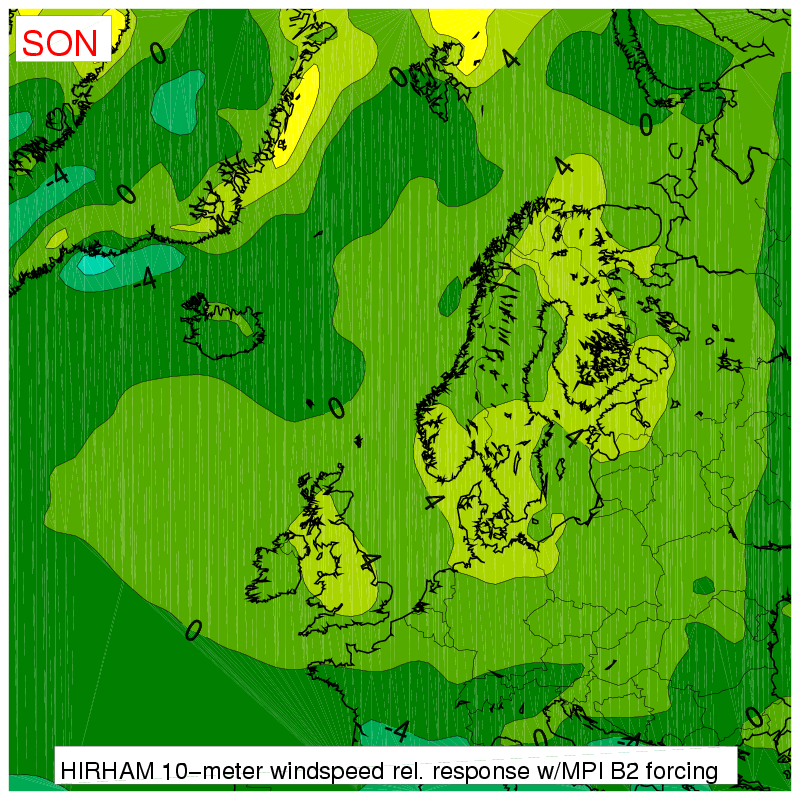
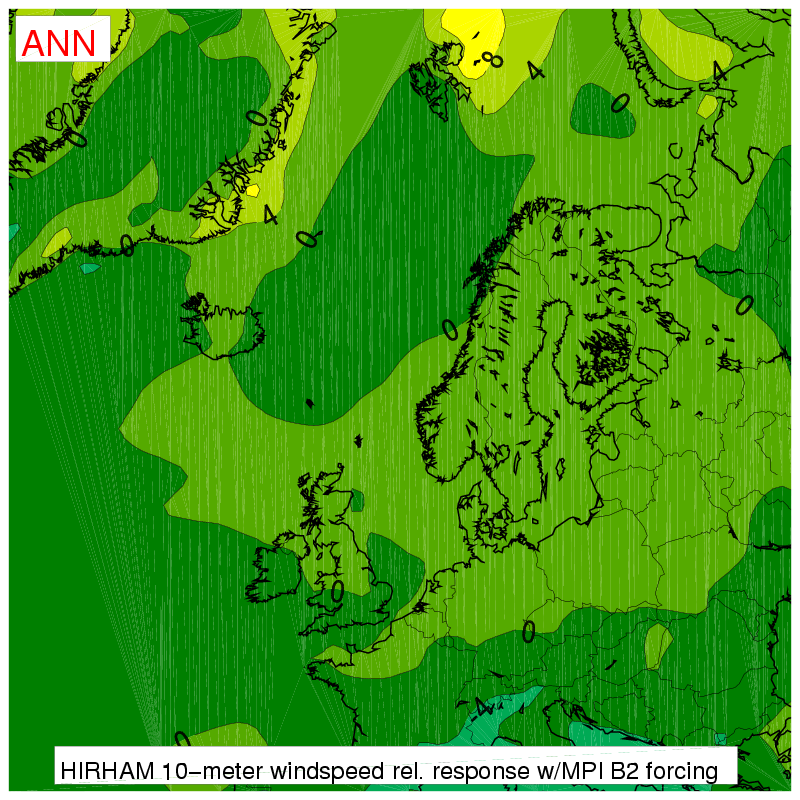
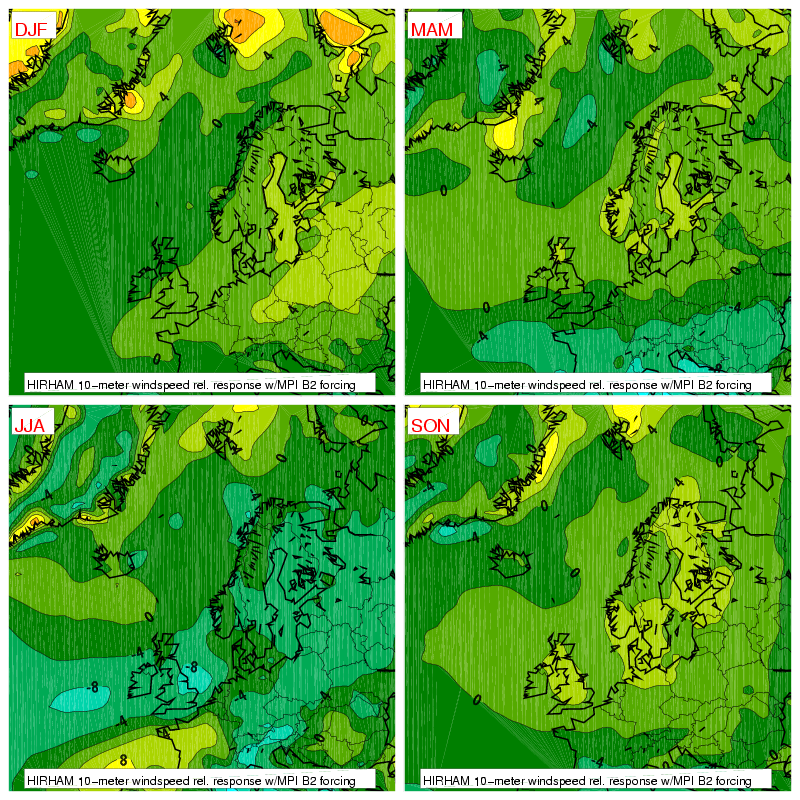
The results from downscaling with the HIRHAM regional climate model are displayed as
maps with seasonal and annual mean change (response) of some near surface parameters
from the control period (1961-1990) to the scenario period (2071-2100). The area is
the full HIRHAM domain except the outer frame of 250km width (used for relaxation to
the global forcing data). The maps are in two-formats; encapsulated postscript (eps)
and portable network graphics (png), where the png-files have been converted from the
eps-files. The eps-files have been compressed with the linux gzip command.
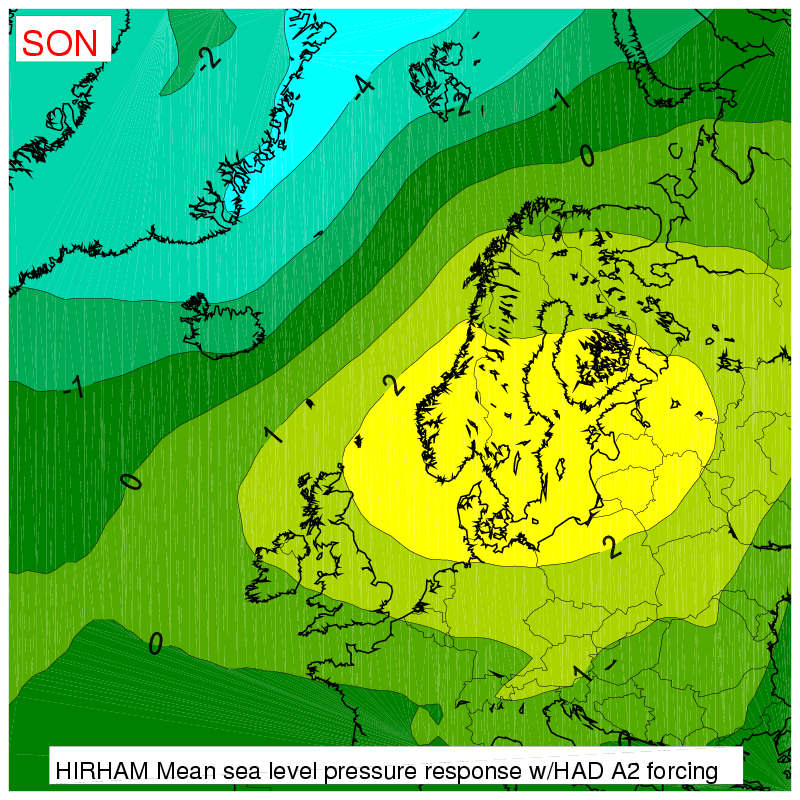
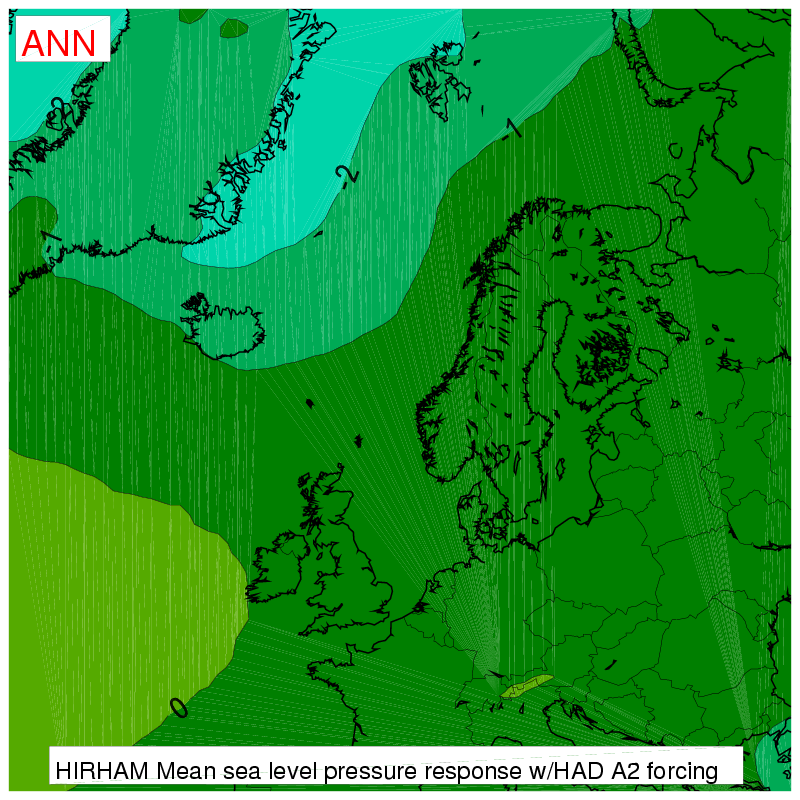
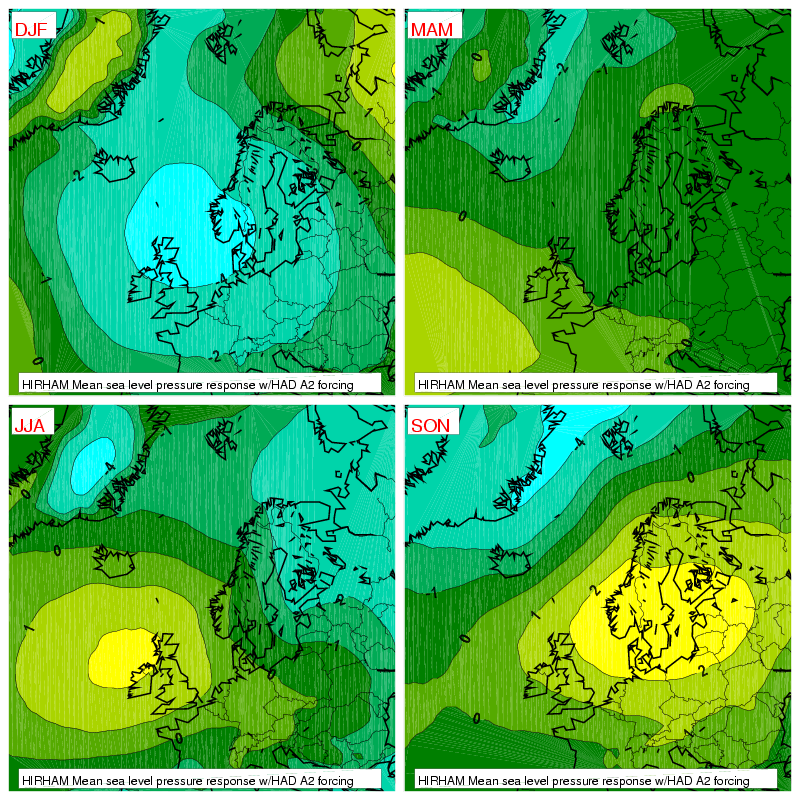
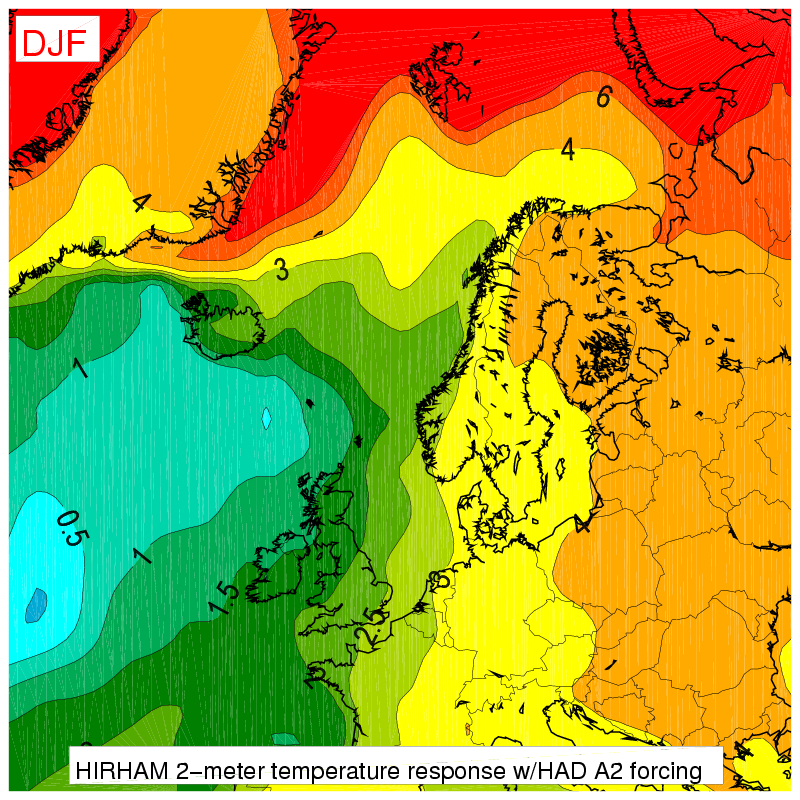
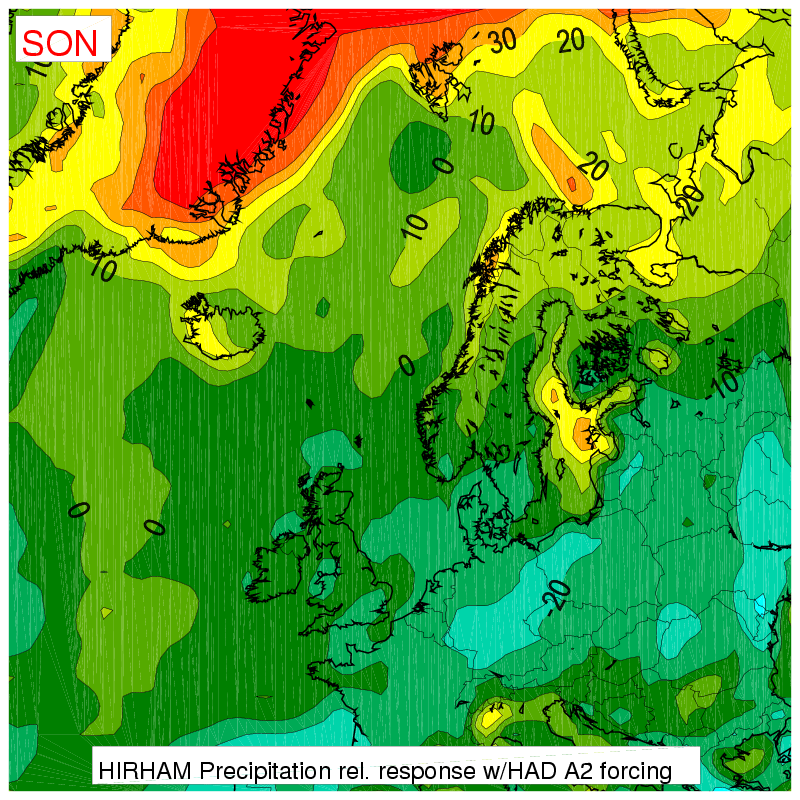
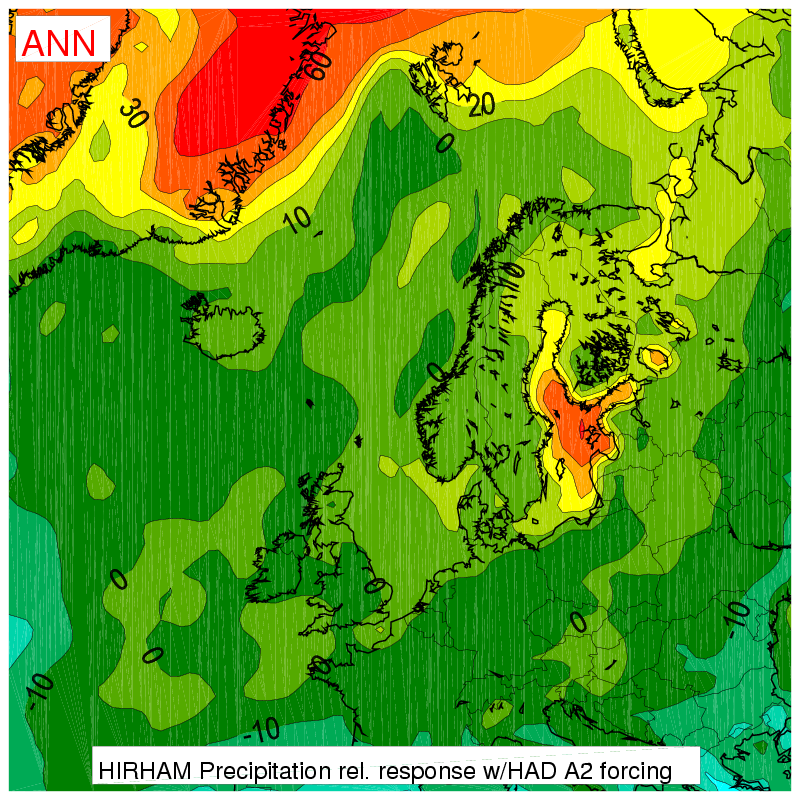
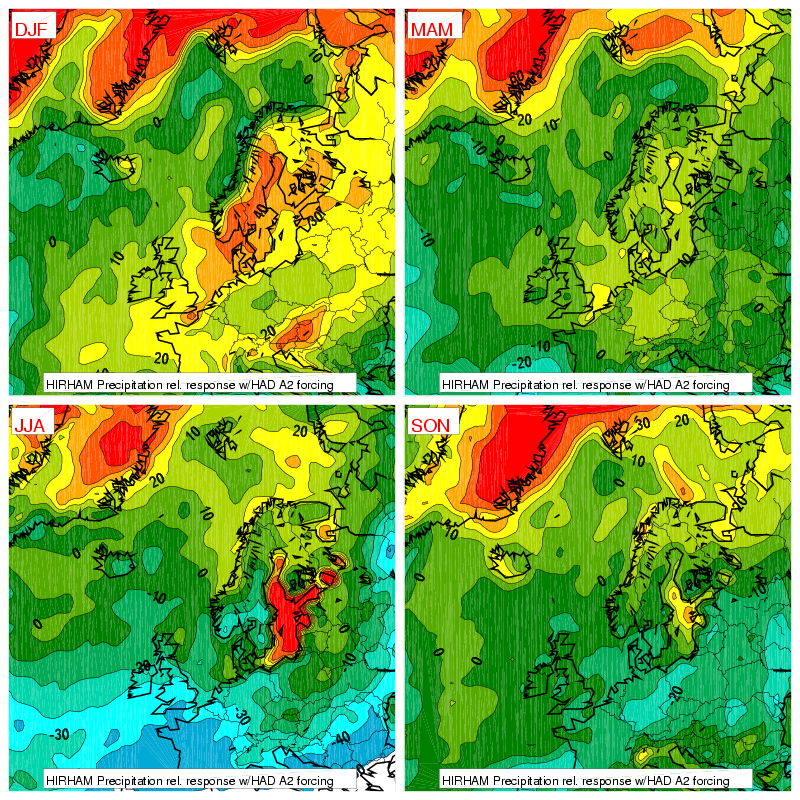
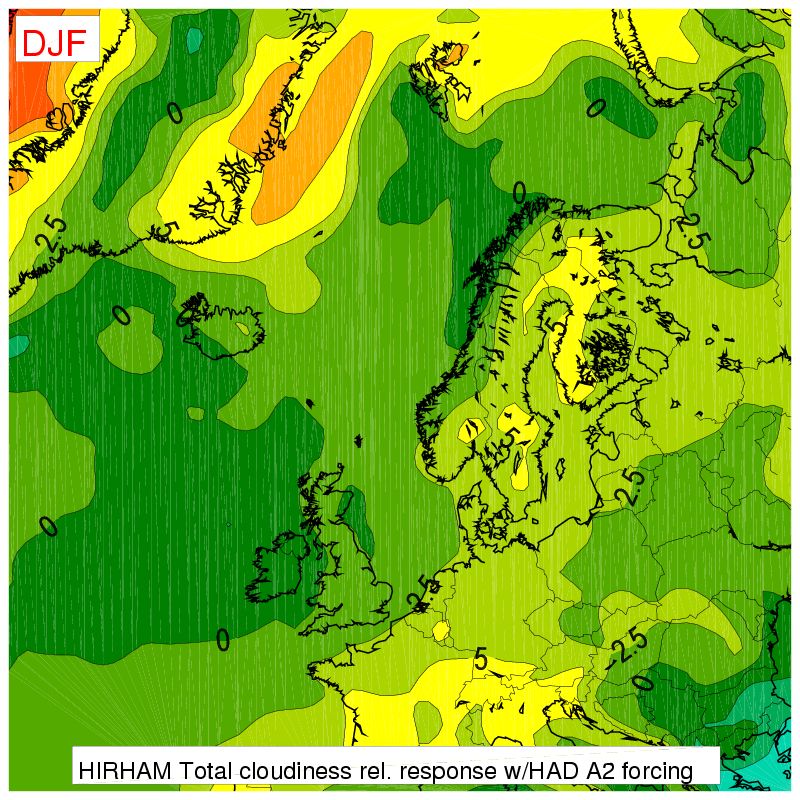
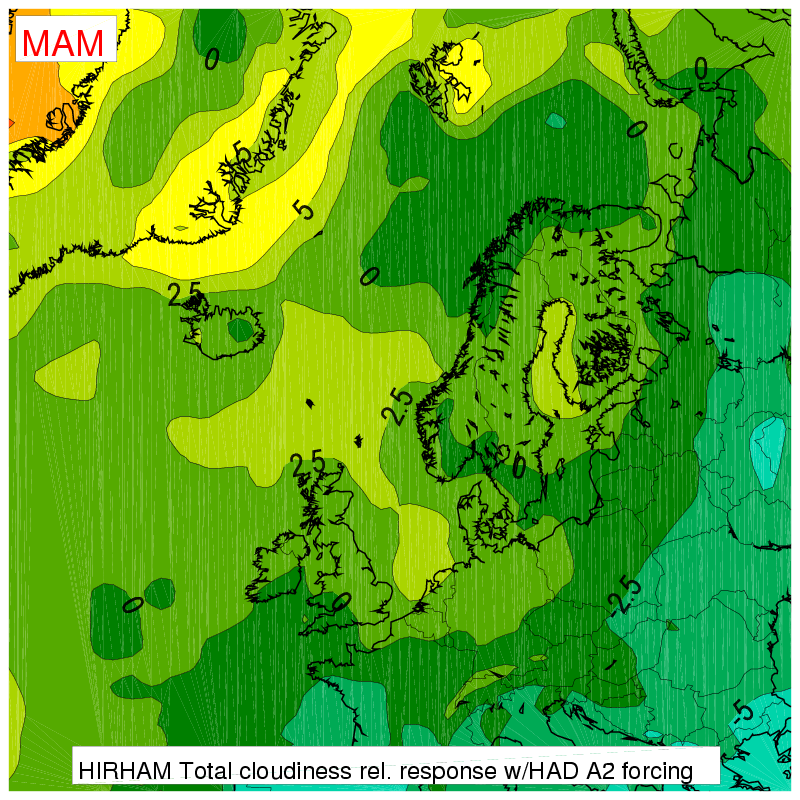
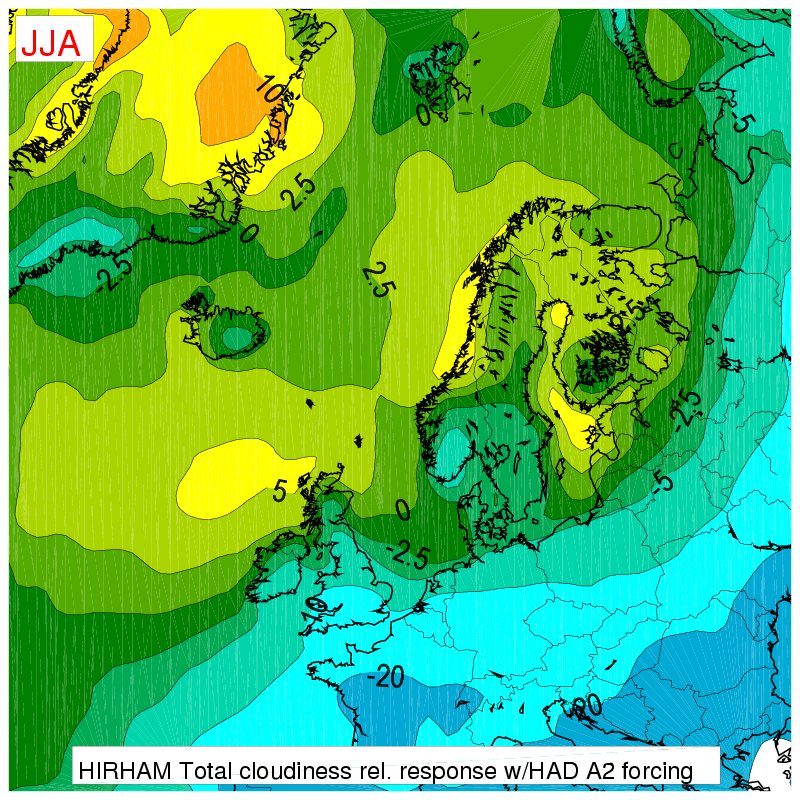
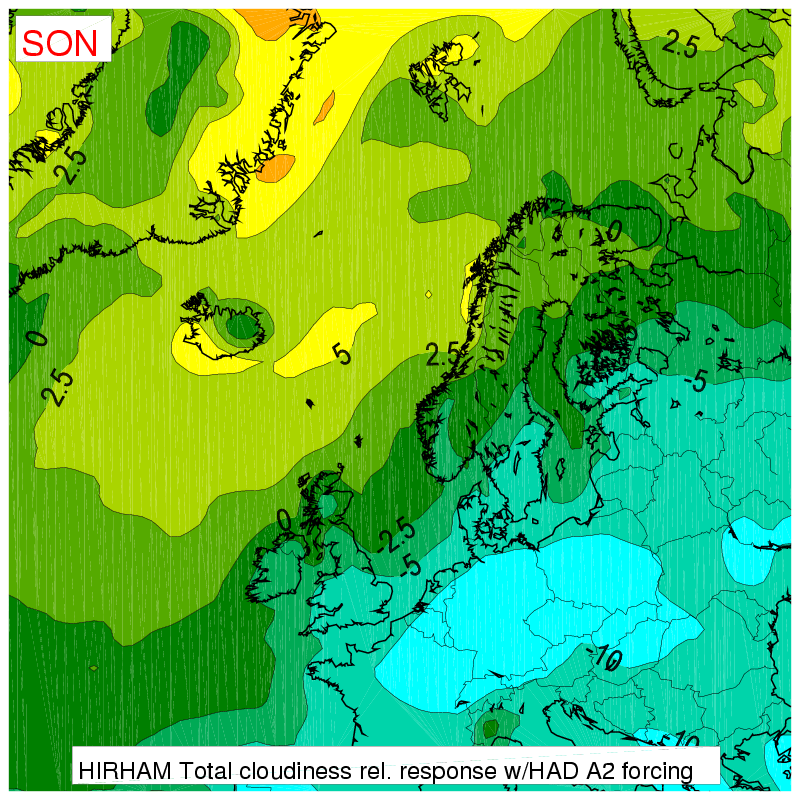
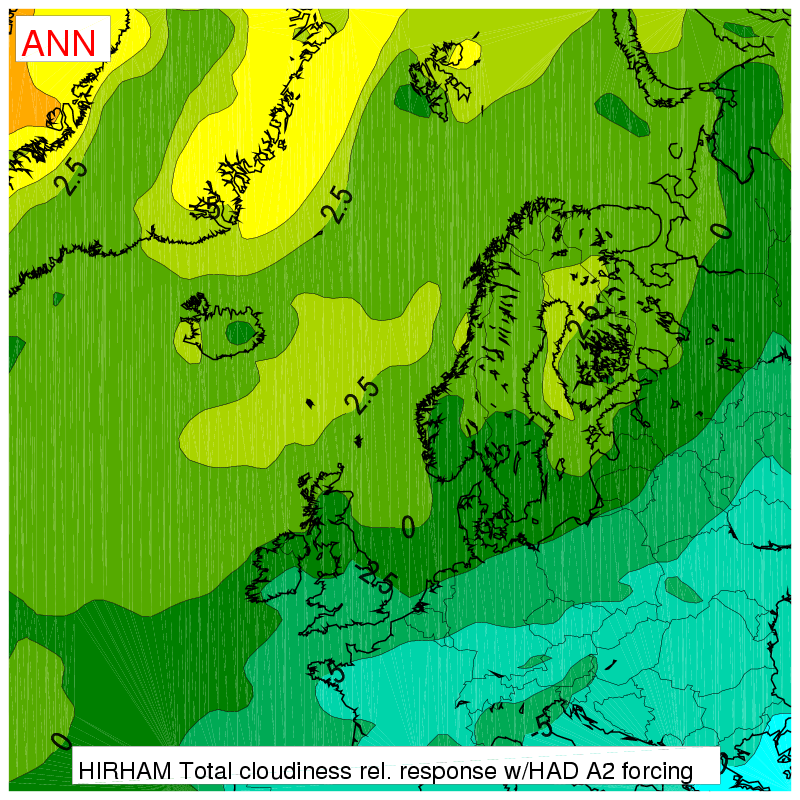
The maps show individual seasonal means (winter=DJF, spring=MAM,
summer=JJA, autumn=SON), annual means (Annual) and a common figure for the 4 seasons
(Seasonal).For pressure and temperature the response
is shown in absolute value (hPa and K).For precipitation, cloudiness and
windspeed the response is shown in %, relative to the control period.
The contour lines are common in all figures for the respective
parameter.
In PNG-format:
Hadley Centre A2 response maps:
Mean sea level pressure |
DJF |
MAM |
JJA |
SON |
Annual |
Seasonal |
2-meter temperature |
DJF |
MAM |
JJA |
SON |
Annual |
Seasonal |
Precitation |
DJF |
MAM |
JJA |
SON |
Annual |
Seasonal |
Total cloudiness |
DJF |
MAM |
JJA |
SON |
Annual |
Seasonal |
10-meter windspeed |
DJF |
MAM |
JJA |
SON |
Annual |
Seasonal |
Hadley Centre B2 response maps:
Mean sea level pressure |
DJF |
MAM |
JJA |
SON |
Annual |
Seasonal |
2-meter temperature |
DJF |
MAM |
JJA |
SON |
Annual |
Seasonal |
Precitation |
DJF |
MAM |
JJA |
SON |
Annual |
Seasonal |
Total cloudiness |
DJF |
MAM |
JJA |
SON |
Annual |
Seasonal |
10-meter windspeed |
DJF |
MAM |
JJA |
SON |
Annual |
Seasonal |
Max Planck Institute B2 response maps:
Mean sea level pressure |
DJF |
MAM |
JJA |
SON |
Annual |
Seasonal |
2-meter temperature |
DJF |
MAM |
JJA |
SON |
Annual |
Seasonal |
Precitation |
DJF |
MAM |
JJA |
SON |
Annual |
Seasonal |
Total cloudiness |
DJF |
MAM |
JJA |
SON |
Annual |
Seasonal |
10-meter windspeed |
DJF |
MAM |
JJA |
SON |
Annual |
Seasonal |
In EPS-format:

Hadley Centre A2 response maps:
Mean sea level pressure |
DJF |
MAM |
JJA |
SON |
Annual |
Seasonal |
2-meter temperature |
DJF |
MAM |
JJA |
SON |
Annual |
Seasonal |
Precitation |
DJF |
MAM |
JJA |
SON |
Annual |
Seasonal |
Total cloudiness |
DJF |
MAM |
JJA |
SON |
Annual |
Seasonal |
10-meter windspeed |
DJF |
MAM |
JJA |
SON |
Annual |
Seasonal |
Hadley Centre B2 response maps:
Mean sea level pressure |
DJF |
MAM |
JJA |
SON |
Annual |
Seasonal |
2-meter temperature |
DJF |
MAM |
JJA |
SON |
Annual |
Seasonal |
Precitation |
DJF |
MAM |
JJA |
SON |
Annual |
Seasonal |
Total cloudiness |
DJF |
MAM |
JJA |
SON |
Annual |
Seasonal |
10-meter windspeed |
DJF |
MAM |
JJA |
SON |
Annual |
Seasonal |
Max Planck Institute B2 response maps:
Mean sea level pressure |
DJF |
MAM |
JJA |
SON |
Annual |
Seasonal |
2-meter temperature |
DJF |
MAM |
JJA |
SON |
Annual |
Seasonal |
Precitation |
DJF |
MAM |
JJA |
SON |
Annual |
Seasonal |
Total cloudiness |
DJF |
MAM |
JJA |
SON |
Annual |
Seasonal |
10-meter windspeed |
DJF |
MAM |
JJA |
SON |
Annual |
Seasonal |
Figure captions:
The bottom text included in each figure is displayed in the format:
"HIRHAM [Name] response w/[Centre] [Scenario] forcing"
[Par] is the parameter name used in the filename
[Name] is the name of the parameter used in the text
[Centre] is the the centre for global forcing data (HAD=Hadley Centre, MPI=Max Planck Institute)
[Scenario] is the IPCC SRES scenario (A2 or B2)
and the season is displayed in the top left corner:
DJF=winter, MAM=spring, JJA=summer, SON=autumn, ANN=annual
Contour lines:
| Par |
Name |
Contourlines |
Unit |
| MSLP |
Mean sea level pressure |
-8.,-6.,-4.,-2.,-1.,0.,1.,2.,4.,6.,8. |
hPa (mb) |
| T2m |
2-meter temperature |
-0.5,0.,0.5,1.,1.5,2.,2.5,3.,4.,6.,8. |
K (or C) |
| precip |
Precipitation |
-60.,-40.,-30.,-20.,-10.,0.,10.,20.,30.,40.,60. |
% (relative change) |
| clcov |
Total cloudiness |
-40.,-20.,-10.,-5.,-2.5,0.,2.5,5.,10.,20.,40. |
% (relative change) |
| w10m |
10-meter windspeed |
-20.,-16.,-12.,-8.,-4.,0.,4.,8.,12.,16.,20. |
% (relative change) |
An example of extended figure caption for the first map:
"HIRHAM mean sea level pressure response for winter (DJF) from 1961-1990 to 2071-2100 with forcing from Hadley
Centre A2 data, 30-year mean values.
Contour lines are -8.,-6.,-4.,-2.,-1.,0.,1.,2.,4.,6.,8. hPa."
Jan E. Haugen RegClim/met.no 2005
|
 |
|
