shell scripts:
section.sh
Syntax
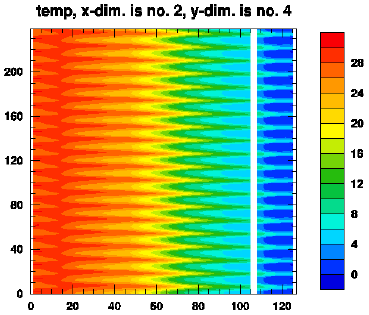
Example: Hovmřller diagram of seasonal variations in sea surface temperatures
The figure below was made by issuing the command:
section.sh hycom_031_TS.nc temp 4 2 4 66 1
section.sh: syntax
section.sh --help

        section.sh   /  ncl-metno 1.2

>>>
>>>
>>> Syntax:
>>> =======
>>>
>>>  section.sh <file> <variable> <ndims> <dim1> <dim2> <node1> (<node2>)
>>> where
>>>    <file>      name of netCDF file
>>>    <variable>  name of variable to depict
>>>    <ndims>     no. of dimensions of the variable (3 or 4; for 2, use contour.sh xy ...)
>>>    <dim1>      crossection's 1. dimension no. (1-3) [Fortran style]
>>>    <dim2>      crossection's 2. dimension no. (2-4) [Fortran style]
>>>    <node1>     node no. of first  non-depicted dimension
>>>                 a negative <node1> value is interpreted as a flag that
>>>                  stops the ncl script from being deleted
>>>    <node2>     node no. of second non-depicted dimension (if <ndims> is 4)
>>>
>>>  The script will produce an eps-file and a png-file.
>>>
>>>
>>> User specifications:
>>> ====================
>>>
>>>  By copying the default spec.s from
>>> /home/arnem/lib/ncl-metno/userdef.ncl
>>>  to the directory where the command 'section.sh' is given,
>>>  the user may specify
>>>   * title
>>>   * font
>>>   * zooming
>>>   * color map (palette)
>>>   * no. of colors
>>>   * plot size limits
>>>   (look up, or copy, this file to edit your own 'userdef' file).
>>>
>>>
>>> Example:
>>> =========
>>>
>>>  section.sh sst.nc sst 3 1 3 60
>>>    if the first and second dimensions are longitude and
>>>     latitude, and the third is time, this will produce
>>>     a hovmoller diagram of sst variability along latitude
>>>     node no. 60, based on results on the file 'sst.nc'
>>>
>>>
>>> Terminating.