Project information:
Resources:
Sponsor:
The relative role of the various fresh water sources
|
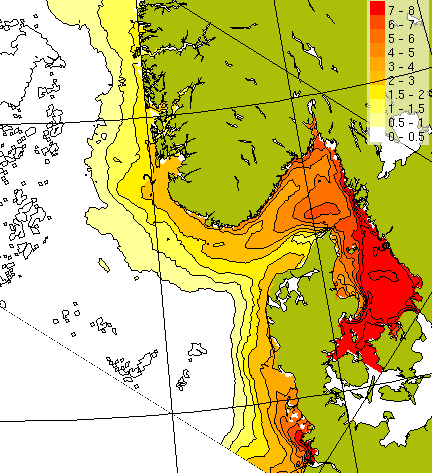
Here, we compare model results for salinities the Skagerrak/Kattegat/eastern North Sea. These results were obtained when only parts of the fresh water forcing was included (or no such forcing), with results that were obtained when all sources were included. By fresh water forcing, we here mean both the direct run-off into this basin, and the indirect run-off via fluxes of brackish waters from the Baltic Sea. The depictions show the salinity surpluses (at 5 m depth) that arises under the various reduced fresh water forcing cases. Values are in practical salinity units (PSU). Case I: No fresh water forcingWhen fresh water forcing is disregarded altogether, the salinity in the Kattegat rises by about 5-9 PSU, whereas the salinity in the Skagerrak rises by 2-6 PSU. Values west of Jutland and in the NCC in the eastern North Sea increase by 1-3 PSU: |
|
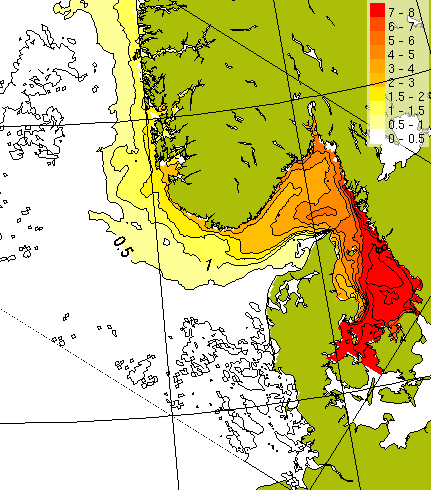
Case II: Continental rivers onlyNext, consider results when only continental rivers that feed into the southern North Sea, are included. We then find results that are very similar to Case I, with a major exception: The salinity deviations along the west coast of Jutland are now eliminated: |
|
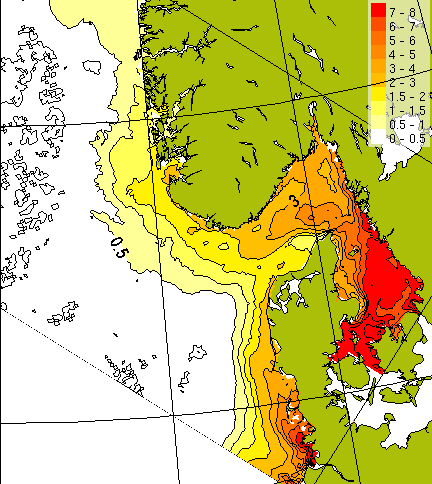
Case III: Norwegian and W. Swedish rivers onlyThen, consider results when only Swedish and Norwegian rivers that feed into the Kattegat, Skagerrak and the North Sea, are included. Salinity offsets now display a pattern that is very similar to Case I, but the deviation from the "full forcing simulation" is now reduced by 0.5-1 PSU along the coasts of Sweden and Norway: |
|
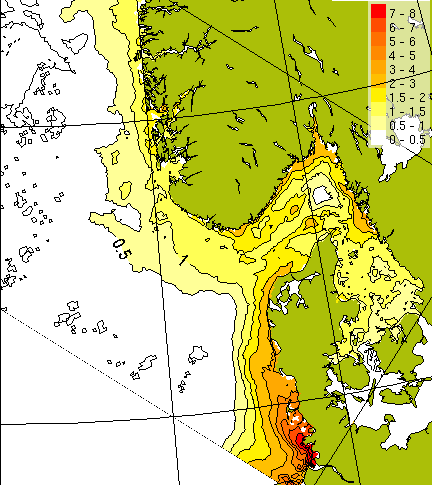
Case IV: Baltic outflow onlyFinally, consider the case when the outflow of brackish water from the Baltic Sea through the Belts and Öresund are applied. The deviations from the"full forcing simulation" is now only about 1 PSU in the entire domain except for the coastal region to the west and the south-west of Jutland (deviation maxima are also seen along the rim of the Skagerrak): |
|