Project information:
Resources:
Sponsor:
Salinity bias in the NCC
|
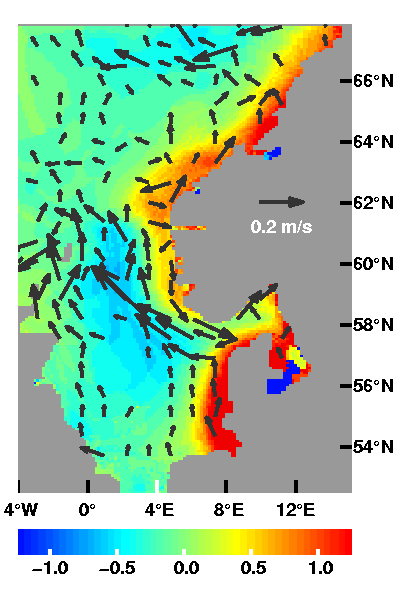
Here, the differences in March between salinities and velocities in model results and the IMR/met.no prognostic archive are displayed. Values from the IMR/met.no archive were subtracted from the corresponding model results. This depiction can thus be interpreted as transport of salinity anomalies in the model results. The wide coastal current in the model can here be seen as a fresh anomaly that is transported northwestward, west of the Norwegian trench in the North Sea. We also observe that a salt anomaly is transported from the German bight along the west coast of Jutland. This relatively salty water apparently affects the salinities in the northern Kattegat. In this way, the NCC becomes too salty in the model, and the front between the NCC and the Atlantic water is too weak. Hence, the wide NCC in the model reflects a buoyancy that is lower than in the IMR/met.no climatology. |
|